

Nutrient content in soil varies over years, between fields and within fields. Soil sampling and analysis methods were developed to assess the fertility level and to predict potential crop response to applied fertilizer or manure. Although soil testing is an estimation, it can help give reasonable guidelines for profitable fertilizer application as part of the right rate considerations when following the 4R nutrient stewardship practices.
Important tips
- Soil testing is recommended to give an accurate starting point to base fertility decisions on. Testing can be done in the spring or fall. If fall soil testing, test as late as possible to give an accurate assessment of what the nutrient levels will be in the spring.
- Most soil sampling in the Prairies is now conducted by private or industry agronomists who are equipped with modern sampling equipment. Nevertheless, it is important that they follow accepted sampling protocols and sample handling practices to ensure accurate results that will lead to good recommendations.
- Submitting one composite sample per field can provide a general impression of soil nutrient levels. Take 15-20 sub-samples from the most representative areas of the field (not hill tops, not low spots, avoid saline areas) to provide a more accurate composite. Well-chosen GPS benchmarked locations have some potential to improve future soil tests and comparisons. Growers should ensure anyone doing custom sampling for them is aware of any unusual areas of the field that may skew results as well as the location of previous fertilizer bands in the soil.
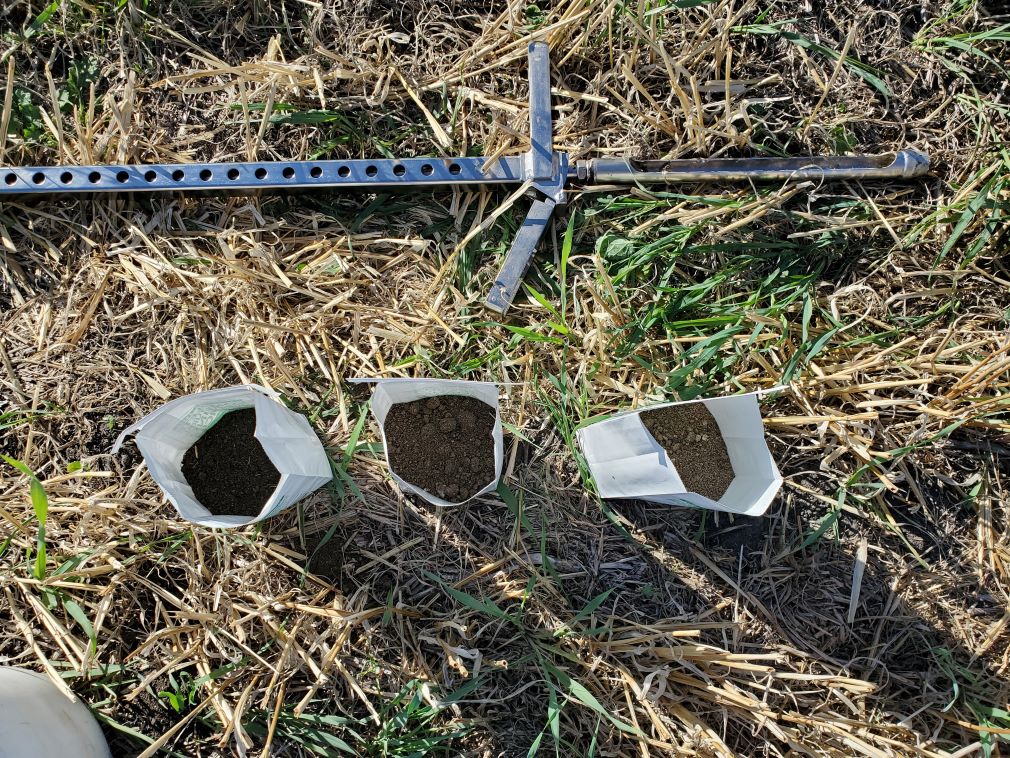
- Submit samples for soil depths of 0-15 centimetres (0-6 inches), 15-30 centimetres (6-12 inches) and 30-60 centimetres (12-24 inches), or 0-15 centimetres (0-6 inches) and 15-60 centimetres (6-24 inches). Incremental depths can give a better indication of nutrient stratification.
- The most accurate sampling time is just prior to seeding. However, this isn’t practical because time is needed to purchase and perhaps place the fertilizer before seeding. Therefore, the options are:
- Early spring sampling done after the soil has thawed and is no longer saturated from snow melt. Some sampling can be done by well-equipped agronomists prior to frost melt.
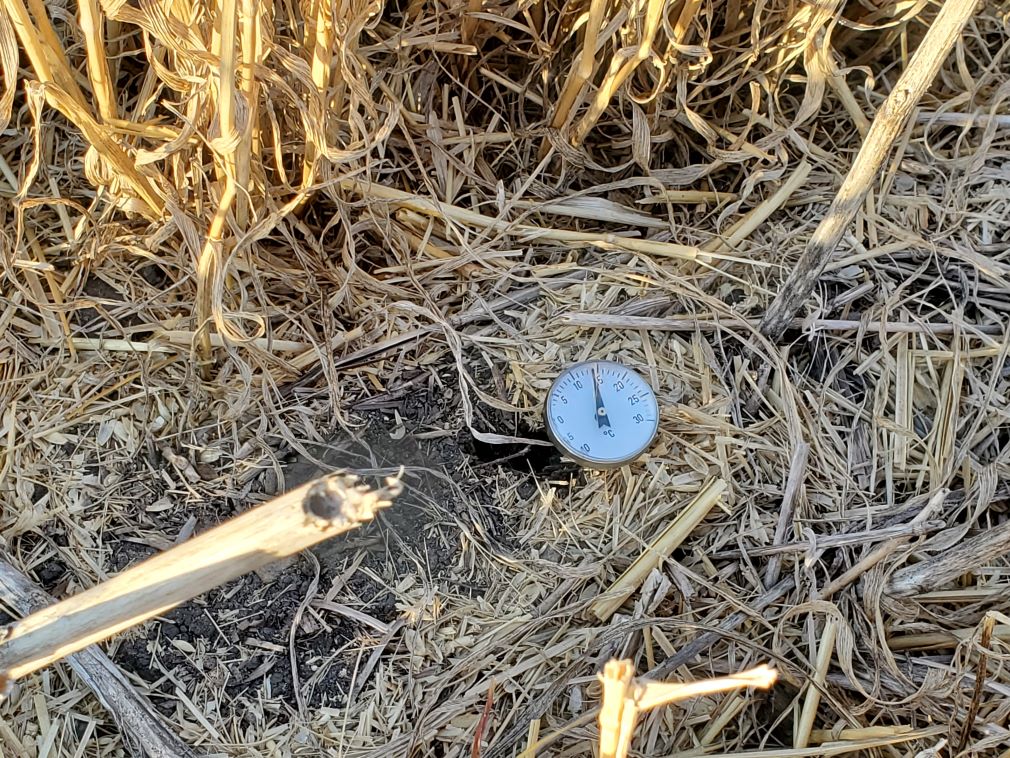
- Fall (preferably late fall) sampling after harvest, once the soil has cooled to at least 10°C or cooler. This helps reduce nutrient content changes due to microbial activity that may occur prior to seeding next spring.
- Soil testing is an important part of 4R Nutrient Stewardship practices.
- Learn more about the right time for soil sampling in this Canola Watch fundamentals article.
- Check out the Soil tests can help producers optimize fertilizer rates and improve profitability blog on the Canola Research Hub.
Soil testing
Nutrient content in soil varies over years, between fields and there is even inherent nutrient spatial variability within fields that appear uniform. Soil sampling and analysis methods were developed to assess the fertility level and to predict crop response to applied fertilizer or manure (understanding that unpredictable growing season weather may also have an impact). Although soil testing is just an estimation, it can help give reasonable guidelines for profitable fertilizer application as part of the right rate considerations when following the 4R nutrient stewardship practices.
However, spatial nutrient variability in fields creates problems for soil testing and fertilizer application. It makes it difficult to obtain an accurate representation of the whole field (and to decide on one rate, if needed). If applying one fertilizer rate across a variable field, some areas will be over-fertilized and others will be under-fertilized. Although variable rate fertilization is being used in some fields, operations that don’t have the proper equipment still fertilize with a single rate. In addition, since fertilizer response calibrations were developed from research sites with low variability, they may not always predict the optimum fertilizer rate for larger farm fields with more variability.
Proper soil sampling is necessary for meaningful soil test results. A sampling error in the field is usually much greater than the analytical error in the lab. Ensure soil samples accurately reflect the overall field, or zones within the fields for more intensive management.
Collecting one composite sample for the whole field remains a common practice for acceptable precision and accuracy. The accuracy (how correctly the sample value represents the true field average) of a composite soil sample increases with the number of sub-samples taken. Precision describes how often the same value can be obtained when repeating the procedure (reproducibility). The common recommendation to sample a field 20 times and mix all the samples into one composite produces an accuracy of about ±17 per cent for nitrate (NO3-), assuming 80 per cent precision. This is an acceptable level of accuracy and precision for fertilizer recommendation purposes in most cases.
In addition to adequate sample numbers, proper soil sampling techniques include:
- where and how to sample each field (a sampling plan)
- proper equipment
- proper sampling time
- correct depth
- proper sample handling
Four soil sampling strategies
Each field should be sampled separately. The first step is to sampling is to assess the field variability and identify representative areas. The type and level of variability can influence the choice of sampling plan. Consider these four basic sampling plans:
- Random soil sampling uses a random pattern across a field, targeting the mid-slopes by generally avoiding unusual or problem areas such as hilltops, potholes and saline areas. Bulk together 20 soil cores into one composite sample then send to a soil test lab. This common method is adequate for smaller, relatively uniform fields.
- Zone or topographic sampling involves sampling multiple common zones of a field based on soil differences, topography or other criteria such as elevation, yield maps, electrical conductivity, aerial images or combinations. Identify the dominant topographic features such as hilltop, mid-slope and bottom slope, and take 20 core samples for each zone. Bulk sub-samples from each type into one composite sample for each landscape zone. Send samples from each zone to the testing lab. This method can provide more meaningful results for variable fields, but at additional expense and labour. To improve profitability and from this added cost you must be willing and able to apply different fertilizer rates in the separate landscape zones.
- Benchmark sampling is based on selecting small areas of the field that are representative of either the whole field or large zones within the field. Benchmark sampling areas are much smaller than the whole field, and samples are taken from the same spot within these benchmark areas each time the field is sampled. Sampling in the same spot from year to year is assumed to reduce variability of the test results, and allows tracking of changes in residual nutrient levels over time. This information can be used to validate whether fertilizer application rates are generally matching crop use over the crop rotation. If the benchmarks are carefully selected to represent the majority of the field, then good soil test results can be obtained.
- Grid or systematic sampling follows an organized grid pattern, perhaps every 0.2 to two hectares (0.5 to 5 acres). This method can reveal field nutrient variability and allow for variable rate fertilization and precision farming techniques. However, the sampling and analysis costs are generally not economical, and fields with high amounts of variability would require a much more intensive sampling grid to achieve the accuracy needed for variable rate fertilizer applications.
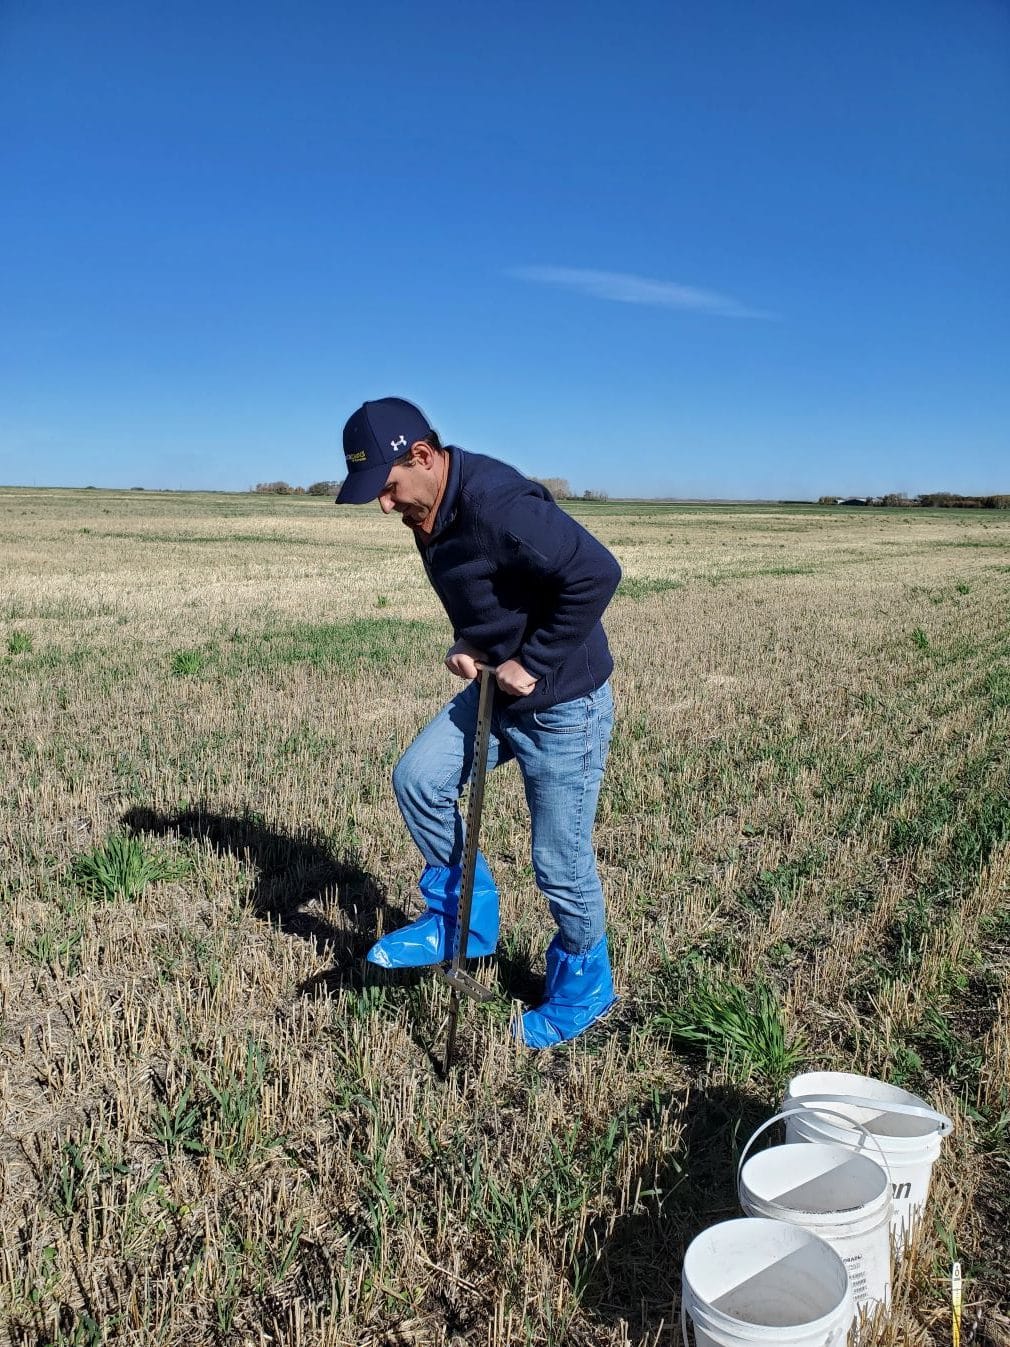
Proper soil sampling equipment
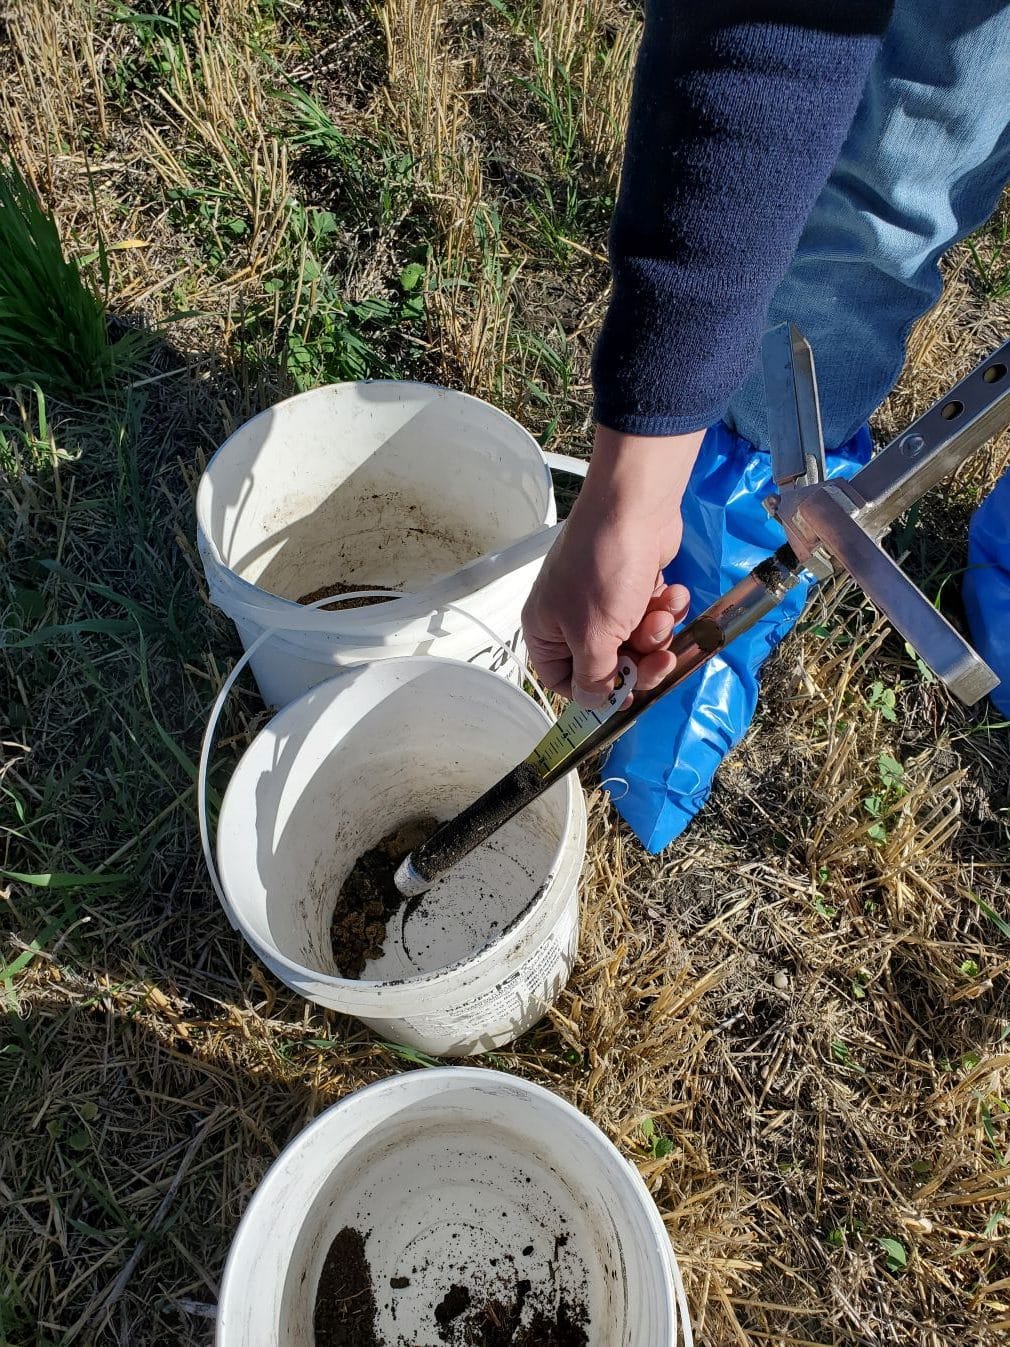
Soil sampling to a 60 centimetre (24 inch) depth can be done with a probe or auger. Do not use flight or screw sampling augers if samples need to be separated by depth since mixing between layers will occur. Many agronomists who sample a large number of fields each year will use a vehicle mounted probe that saves time and labour requirements. If testing for micronutrients, ensure the sampling tool is chrome plated or stainless steel and rust-free. Do not bulk samples in metal pails. Clean plastic pails labeled for location and depth work well. Information sheets, sample bags and shipping boxes are available from soil testing labs and most fertilizer dealers.
Proper sampling date
The most accurate sampling time is just prior to seeding. However, this isn’t practical because time is needed to purchase and perhaps place the fertilizer before seeding. Sampling is commonly done earlier in spring or in the fall. Hand sampling in the spring is done after the soil has thawed and is no longer saturated from snow melt. Mechanically-assisted sampling may proceed with some frost still remaining in the soil.
Late fall soil sampling should occur after soil has cooled to at least 10 degrees Celsius. Cooler soils reduce nutrient content changes due to microbial activity that is dependent on soil moisture and temperature. Sampling at this late fall stage can provide a close reflection of nitrogen levels in the spring prior to planting. Studies have shown that nitrogen availability can increase over the winter, however most of that gain is lost in the spring. Therefore, the net change from late fall to late spring is minimal —as long as soils stay frozen. This may not be the case in areas that are prone to warm Chinook winds in the winter, which could notice significant changes in mild winters.
Late fall sampling tends to more accurately reflect spring nitrate (NO3–) contents than early fall sampling, especially for soils in the Black soil zone.
However, research in Manitoba measured very little change in soil nitrate levels in cereal stubble from early September to freeze-up.
Conflicting results of the effects of sample timing on phosphorus soil test values may be related to the differences in soil organic matter content and biological activity, and, therefore, potential for microbial changes to the plant available P pool.
Occasionally early fall sampling can create higher than necessary nitrogen and phosphorus fertilizer recommendations due to an underestimation of spring nitrate and available phosphorus, especially in the Black and Gray soil zones. Fertilizer response curves have been calibrated only against spring nutrient contents.
One disadvantage to late fall sampling after soil has cooled to five to seven degrees Celsius, is that fall fertilizer banding opportunities become more limited. By the time the samples are taken, dried, sent to the lab, analyzed and results returned, the soil may have become frozen or covered with snow. On average, soil cools by one degree Celsius every five days in the fall, across the Prairies. Starting the sampling process when soils are 10 degrees Celsius will allow for more time for fall field activities after obtaining the results.
Sampling immediately after combining is not recommended, because it would be the least accurate for measuring nutrient needs for next spring’s crop. This method may be able to show what nutrients, if any, were historically deficient, for the current year’s crop, but further changes in nitrogen levels may occur after sampling if rainfall encourages mineralization or if nitrogen is lost to leaching, denitrification or immobilization. However, sampling immediately after harvest would allow for proper depths of sampling to be maintained. For growers who use tillage, sampling on tilled fields is more difficult since the base soil level has been disrupted with soil loosening.
Correct sampling depth
The common current recommendation is to provide a zero to 15 centimetres (zero to six inches) depth sample and a 15-60 centimetres (6-24 inches) sample or separate 15-30 centimetres (6-12 inches) and 30-60 centimetres (12-24 inches) samples. With most sampling done by commercial agronomists, the grower can ask for the right depth and method to obtain the results they desire, which will depend on the nutrients they are sampling for.
For immobile nutrients such as phosphorus and potassium and most micronutrients, the ideal depth is zero to 15 centimetres (zero to six inches) because fertilizer response calibrations were developed based on that depth. If only the zero to 30 centimetres (zero to 12 inches) depth is sampled, the soil testing labs must use a correction factor to estimate the value for the zero to 15 centimetres (zero to six inches) depth. Since some of these nutrients are relatively immobile, they tend to remain at the fertilizer application depth. Therefore, the zero to 30 centimetres (zero to 12 inches) depth may underestimate the concentration of these nutrients and lead to high fertilizer recommendations.
Proper sample handling
Handle samples carefully to prevent accidental mixing and contamination. Put samples in the fridge overnight if it needs to be stored and send as soon as possible to the lab by courier.
Consistency of soil test lab recommendations
Soil sampling, analysis and interpretation are based on science, but there is variation between methods. Reasonable precision and accuracy are needed in order to efficiently manage fertilizer inputs and maximize returns on the investment. Over the years, various growers, agencies or companies have sent duplicate samples to different labs to compare their analysis and recommendations. Growers may be frustrated by this because values will certainly vary, as will recommendations. This is why it is so important to track soil test levels from year-to-year, and to keep using the same lab.
Ask for actual soil residual nutrient measurements as well as the lab’s recommendations. If recommendations are not in line with fertilizer rates you’d use based on actual soil residual levels, ask the lab how its recommendations are calculated. This will help to better understand how your specific production practices might lead to differences in recommendations.
Two fundamental reasons contribute to differences in results. First, labs may be using different analytical procedures to measure soil nutrient content. For example, there are several methods to extract soil phosphorus. Or the technique may differ slightly when using a particular method.
Variations in soil test recommendations arise mainly due to the differences in each lab’s interpretation. The recommended rates of fertilizer application for the same soil test level can vary significantly between labs. This may be due to using:
- different critical (deficient) soil analysis levels
- regional fertilizer response (calibration) data but modifying recommendations to fit a particular strategy for fertilizer use or economic payback
- recommendations from other regions or countries
- a unique system of fertilizer recommendation not based on regional calibration data or economics
- systems employing short-term economic response versus long-term maintenance of soil test level
Look for labs that participate in the voluntary North American Proficiency Testing Program (NAPT), which circulates soil samples of known nutrient content. Labs test the circulated sample and then are informed as to their performance. Participating labs are listed online.
Overall, soil testing is a useful agronomic practice. Use labs that base fertilizer recommendations on economics using regional calibration data. Be prepared to question unusual recommendations based on experience and the local knowledge of qualified agronomists. Keep in mind that the accuracy of fertilizer recommendations will always be limited by sampling challenges and the inability to predict the weather of the upcoming growing season.
Soil analysis methods
Make sure the soil analysis lab is using a nutrient extraction method that best suits the soil type that the samples are being taken from. For example, phosphorus analysis methods can vary between labs. Prairie labs use the Modified Kelowna or Olsen methods for phosphorus analysis (and in the case of the Modified Kelowna method, for nitrate-nitrogen and potassium as well.) Whereas some labs use the Bray method, which is an acid extractant method that is not suitable for alkaline soils and has not been calibrated for western Canadian soils.
The following is a list of methods used across the Canadian Prairies. Note that this list does not include “root simulator technology,” an alternative method for determining nutrient supply rates from the soil.
- Nitrogen (Nitrate-N): Alberta labs typically use the Modified Kelowna (acetic flouride) method. Others use the calcium chloride test.
- Phosphorus: Modified Kelowna (acetic flouride) method is common in Alberta and Saskatchewan. Olsen (sodium bicarbonate) is well-suited to alkaline soils and is the common method in Manitoba.
- Potassium: Modified Kelowna (acetic flouride) or ammonium acetate methods are the two in common use on the Prairies.
- Sulphur (Sulphate-S): Calcium chloride method is the standard method.
- Copper, iron, manganese, and zinc: Diethylene triamine pentaacetic acid (DTPA) method is standard.
- Boron: Hot water extraction is standard.
Plant and tissue testing
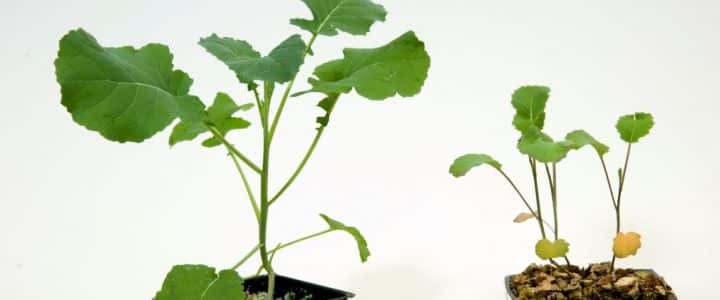
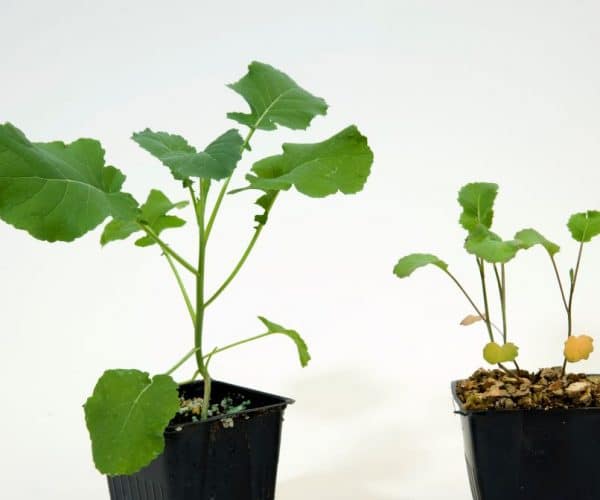
Plant and tissue analyses can supplement, but not replace, soil testing. Tissue sampling can be used to diagnose problems that may be nutritionally related and to identify any nutrients that may be restricting yields, but it does have serious limitations. Tissue nutrient levels vary significantly depending on the stage of plant growth, plant parts sampled, and the time when samples are collected (e.g. time of day or timing relative to environmental stresses).
No reliable interpretative criteria exist for nutrient ranges in seedling canola. Since nutrient contents usually differ considerably between different plant parts and ages, the proper plant part must be sampled at the proper growth stage.
Each tissue testing lab will have slightly different requirements for taking and submitting samples. In general, avoid unusual, dead or stressed plants, as well as those covered with soil or recent sprays. Cut samples with a clean, rust-free knife or scissors.
Table 4. Plant tissue analysis interpretative criteria for canola (whole above ground plant at flowering)
Send separate samples from good and poor areas within a field. Make sure the plants in each area are at the same growth stage. Comparing the plant analysis results from areas of a field that differ visibly in growth can be difficult to interpret because nutrient content differences can be confounded by growth differences. If the two areas differ mainly in deficiency symptoms, then comparative sampling can be useful. In this case, collect the samples soon after the symptoms appear and before major differences in growth and maturity occur.
Plant and tissue analyses measure the nutrient content of above ground plant parts. The values are compared to established ranges for inadequate, adequate and excess levels. Table 4 shows sufficiency levels for most plant nutrients in flowering canola.
How to diagnose nutrient deficiency symptoms
A systematic diagnosis of visible symptoms is needed to correctly identify limiting nutrients. Symptoms usually appear on either old or young leaves depending on the mobility of the nutrient in question. Chlorosis (yellowing, loss of green colour) and necrosisA symptom of plant cell or plant tissue death. More (death of plant tissue, often leading to white or brown colour) are important visible symptoms. Diagnosis under field situations can be complicated by high field variability, multiple deficiencies, and other causes such as weather, pests and herbicide injury. For example, a sulphur deficiency can easily be confused with Group 2 herbicide injury due to similar symptoms.
Proper diagnosis of nutrient deficiency should utilize (or consider) most of the following tools:
- Soil test. Are any obvious shortages evident? Other soil test parameters such as texture, pH and electrical conductivity may also provide clues in the diagnosis.
- Fertilizer history. In past years, what rates and source products have been applied on that field? Include crop yields and consider whether rates have been adequate to match removal.
- Tissue test. Do not use this alone. A tissue test may show that the plant is deficient in phosphorus or calcium, for example, but heavy rains and saturated soils may have stopped nutrient uptake. The nutrients may be in the soil at adequate rates, but the plant simply can’t access them. So even if the tissue test shows deficiency, a rescue application of these products will not help. Plants may recover on their own when soils dry out again.
- Herbicide history. Is there any chance of carryover from products applied one or two years ago? In dry conditions or very wet conditions, herbicides can take longer than expected to break down to safe recropping levels for canola. Sprayer tank contamination is another cause of symptoms related to herbicides. Look for patterns that would indicate herbicide applications or more randomness that might indicate nutrient deficiencies.
- Environment. Cold, wet, hot and dry can all stress canola plants, creating symptoms that may look like nutrient deficiencies due to restricted root growth or limited access to soil nutrients. If neighbors have similar symptoms, the cause is probably environmental — frost, excess moisture, etc.
- History of the land. Recently broken forage land is likely to be depleted in a lot of nutrients. Canola seeded into a field that was in long-term alfalfa, for example, is one case where you may see severe crop stunting and delayed maturity as a result of phosphorus deficiency. Otherwise it is rare to see severe phosphorus deficiency in canola, but it can occur with high yields and tight rotations that will start to mine the soil of its reserves.
- Look at other fields for similar symptoms. When diagnosing for a specific nutrient, target the crop that tends to be most sensitive to that nutrient. If your farm is depleted of copper for example, this deficiency is likely to show up in wheat before any other crop.
Using optical sensors (e.g. Greenseeker) is another method to measure and correct nitrogen deficiencies in a field. These optical sensors estimate crop biomass, yield potential and crop nitrogen requirements. The sensors can be attached to a nitrogen applicator and provide continuous and instantaneous readings for variable rate applications.