Soil samples indicate soil nutrient reserves available for crop uptake. This is useful any year, and especially after low-yielding or high-yielding years when reserves may be more difficult to predict. Test results will help farms set fertilizer rates specific to the needs and yield potential of each field – a key step in implementing the right rate principle of 4R Nutrient Stewardship practices.

Right time
Soil sampling just prior to seeding provides the most accurate measure of nutrients available to the crop, but this timing has practical limitations. Results may not come in time. And spring can be tough to get representative cores due to soil moisture conditions.
Late fall soil sampling can be almost as accurate and has various advantages: less time pressure to get samples collected and analyzed, especially if done after harvest; more time for fertilizer planning, including variable rate prescription maps; and the opportunity to buy the right amount of fertilizer at a lower price. (Prices are often, but not always, lower in the fall.)
- Fall timing for next year’s planning. Sampling after soil has cooled to below 10°C reduces the microbial activity that can mobilize nutrients. Soil samples collected after this activity slows down will more closely reflect spring nitrate (NO3–) contents. If farms plan to band fertilizer in the fall, sampling when soils drop to 10°C (not too much lower) should allow for fall application before the ground freezes. If not planning fall applications, sampling can occur close to freeze up – as long as probes can extract good cores.
- Fall timing to assess this year’s fertilizer program. Sampling immediately after combining may show what nutrients, if any, were deficient for the current year’s crop and help plan for better results in next year’s crop.
Cost
Custom sampling in two parts (0-6″ and 6-24″) and lab analysis of that two-part soil sample will cost around $100. Cost per sample will be lower when a farm submits more samples. At $1, or less, per acre, soil sampling will pay off if farmers use results to make more refined fertilizer rate decisions.
Number and location of samples
Composite samples
One composite sample per field can provide a general impression of soil nutrient levels. This result is suitable to set a blanket nutrient rate for the whole field. It cannot account for the high degree of nutrient variability across a field. For the composite:
- Take 15-20 sub-samples from the most productive areas – not hill tops, not low spots, not saline areas.
- Divide each core into two or three soil depths and put them into separate pails.
- Suggested depths are 0-6” and 6-24”, or a three-way split of 0-6”, 6-12” and 12-24”.
- With the 15-20 sub-samples separated by depth, blend those samples to create one composite sample per depth.
- Submit each depth in its own sample bag.
The benchmark composite. Farms could GPS-locate one “average acre” in the field and use that pin as a sample point each year. This can provide for more accurate comparison of samples year after year and is faster for the sampler.
Add one or two targeted samples
Farms could advance their composite sampling program by submitting separate samples from additional target areas – hill tops, low spots, saline patches, area with lodged crops. An extra one or two targeted samples can identify fertilizer issues that would not show up in the single composite. Some scenarios:
- An area always subject to lodging may have high organic matter and the extra nitrogen kick causes lodging. It may be possible to reduce nitrogen applications in that area.
- Hill tops can be low in sulphur. If a composite sample from hill tops shows low sulphur, farmers could spread extra sulphur on a few hills. Note that canola has relatively high sulphur demand.
- Low yielding areas may have many reasons for low performance, and a targeted sample could identify those reasons. It could be something relatively easy to manage, such as low potassium. A targeted application could boost yield results, saving the productivity of acres that were not benefiting from the blanket application.
- In-season targeting. Targeted sampling (soil and tissue) could identify in-season issues that could be solved with a targeted top dress. Take samples from the problem areas and compare them to samples from healthy-looking areas within the same field. By comparing results, major differences can point to the potential cause of the poor growth or lodging. If results are similar, the cause may not be nutrient related.
Precision sampling
Farmers and agronomists know that fields have variable levels of productivity. Some farmers are taking steps to manage that variability and increase overall profitability in a field. Identifying variability often relies on a lot more samples per field. Farmers and agronomists interested in precision management can reach out to experienced advisers who will identify productivity zones in each field based on soil characteristics, drainage, topography, salinity and more. They use precision-targeted soil testing to create prescription maps for variable-rate fertilizer applications.
Interpretation
Soil test results from labs will include actual soil nutrient levels as well as fertilizer rate guidelines based on the crop and target yield. See the sample below.
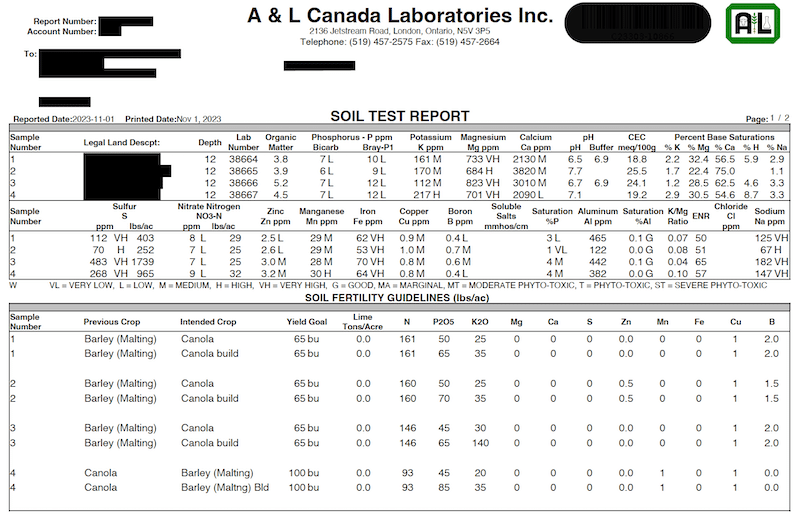
Canola needs, on average, 2.4 pounds of nitrogen, 0.9 pounds of phosphorus, 2.9 pounds of potassium and 0.9 pounds of sulphur per bushel. If the target yield is 50 bu./ac., multiply these nutrient numbers by 50 to get the crop need. Important: These are averages. The ranges are very wide, which is the challenge with rate recommendations. Long-term soils test results paired with yield data can help improve these recommendations. That is why farmers may want to develop their own rate recommendations with their local agronomist based on yield potential, fertilizer prices, crop budgets and their own risk tolerance.
Soil reserves will supply some of that need, which is why the soil test is useful. The rest will come from fertilizer or mineralization.
Mineralization. In making nitrogen rate recommendations, labs do not usually account for potential mineralized nitrogen from organic matter. That makes sense. Predictions are difficult based on lab analysis. Mineralization is highly variable year to year and spot to spot within a field. Soil with low organic matter and low moisture will provide minimal mineralized nitrogen. Soil with high organic matter and ample moisture could, possibly, provide a large percentage of the required nitrogen in a given year. In general, soil can generate six to 30 pounds of available nitrogen per acre for each percentage point of organic matter.
Nitrogen strips. If applying nitrogen in its own blend, it is relatively easy to turn up (and turn down) nitrogen rates for a few strips. Try a few strips with 125 or 150 per cent (and 75, if you want to try a low rate) of the field rate in each field, and check how they show up on the combine yield monitor. These tests done each year will help identify yield potential and most profitable nitrogen rates for the farm. The results may support existing practices or identify a potential adjustment if your nitrogen rate is the yield limiting factor.
New soil analysis tools
Soil scanners and probes use spectroscopy (absorption and emission of light) to provide automatic in-field analysis. Experienced agronomists recommend caution as these tools are expected to provide a high level of inference based on a relatively quick scan. Labs use techniques refined over decades to identify nutrient content at parts per million. If you choose to use this new technology, establish benchmark samples using your previous lab, to ensure analytical consistency and repeatability. Perhaps start with a few fields, then expand your testing once you are comfortable with the results and have established a reliable trend.