Canola Counts is a crowd-sourced survey tool developed by the Canola Council of Canada with support from Alberta Canola, SaskCanola and the Manitoba Canola Growers. It was built to help drive the adoption of plant count and stand establishment assessments as important steps in achieving target yields, while tracking progress towards canola industry production goals. Plant density and emergence values entered in the tool can be saved for spring assessments and for late season or annual comparisons. Data collected through the tool can also be used to generate canola plant density and emergence percentageThe average number (percentage) of seedlings that have grown out of the number of seeds planted this spring. More maps.
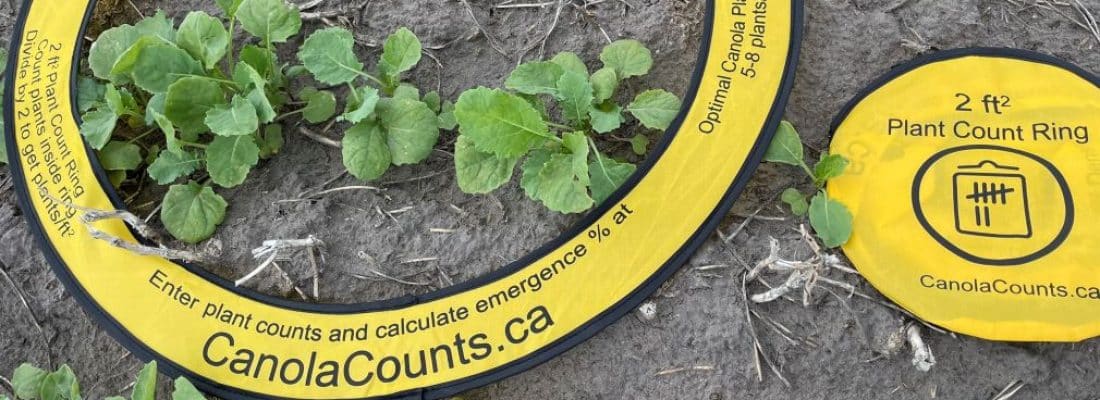
Canola Counts survey overview
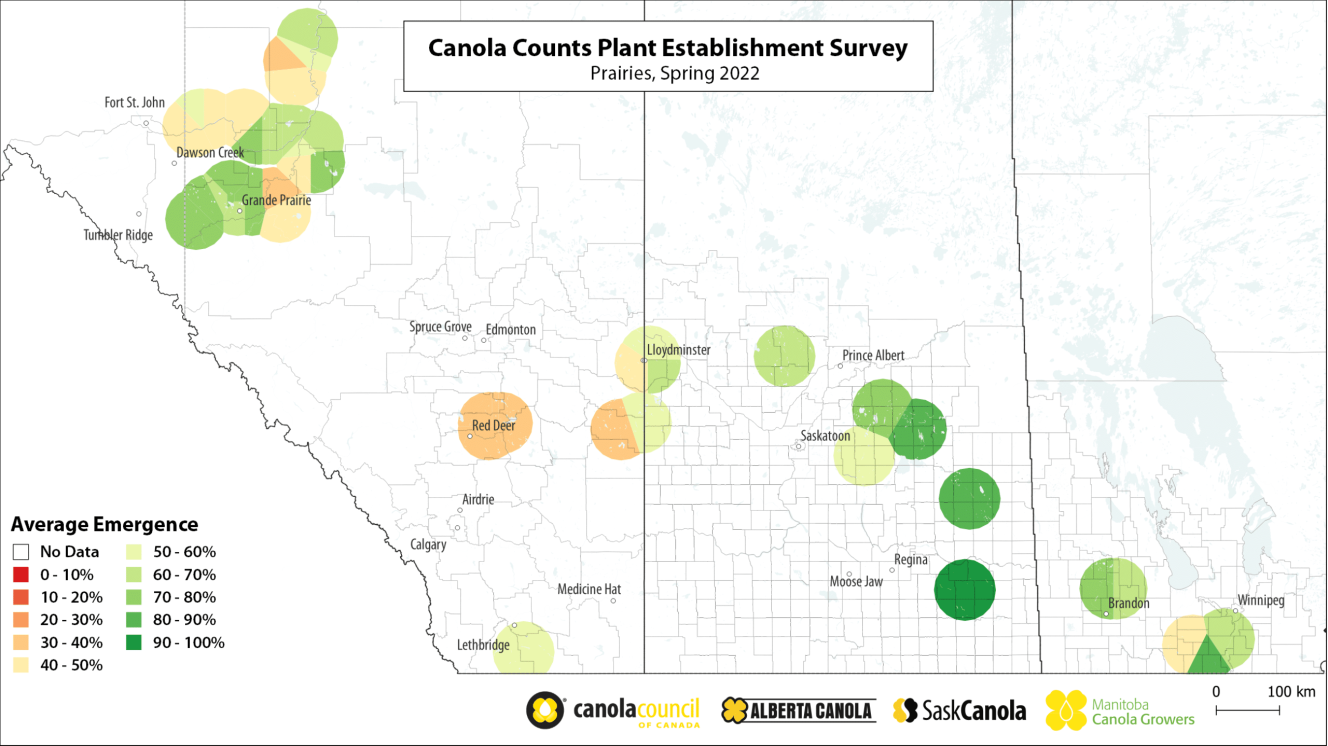
Many canola fields are still averaging 50 to 60 per cent emergence, which means that of every 10 seeds planted, four to five of them fail to emerge and contribute to yield. Conducting plant establishment assessments in every field, every year, will help identify plant establishment challenges and strengths, and can lead to yield improvements for canola growers.
For more information about canola plant establishment or assessing plant stands, visit the plant establishment section of the Canola Encyclopedia.
The Canola Counts maps were created from crowd-sourced data collected through the Canola Counts survey tool at CanolaCounts.ca. Contributors are encouraged to take multiple plant counts (at the 2-4 leaf stage or later in spring, and after harvest in fall) and submit the average plant density for each field. They also had the option of submitting average plant emergence values (directly or as the product of input seeding rate, thousand seed weightThe weight (in grams) of 1,000 canola seeds from one seed lot. More (TSWThe weight (in grams) of 1,000 canola seeds from one seed lot. More) and plant density values).
Post-harvest (fall) stem counts let you calculate a crop’s survival percentageThe average per cent of plants that have grown into yield-contributing plants from the number of spring-planted seeds. More and allow for a comparison with spring plant counts. By collecting a few years’ worth of plant stand data and cross-referencing it with seeding rate, yield, seed quality and maturity records, growers can determine their own most economic target plant stands and seeding rates.
2022 Spring
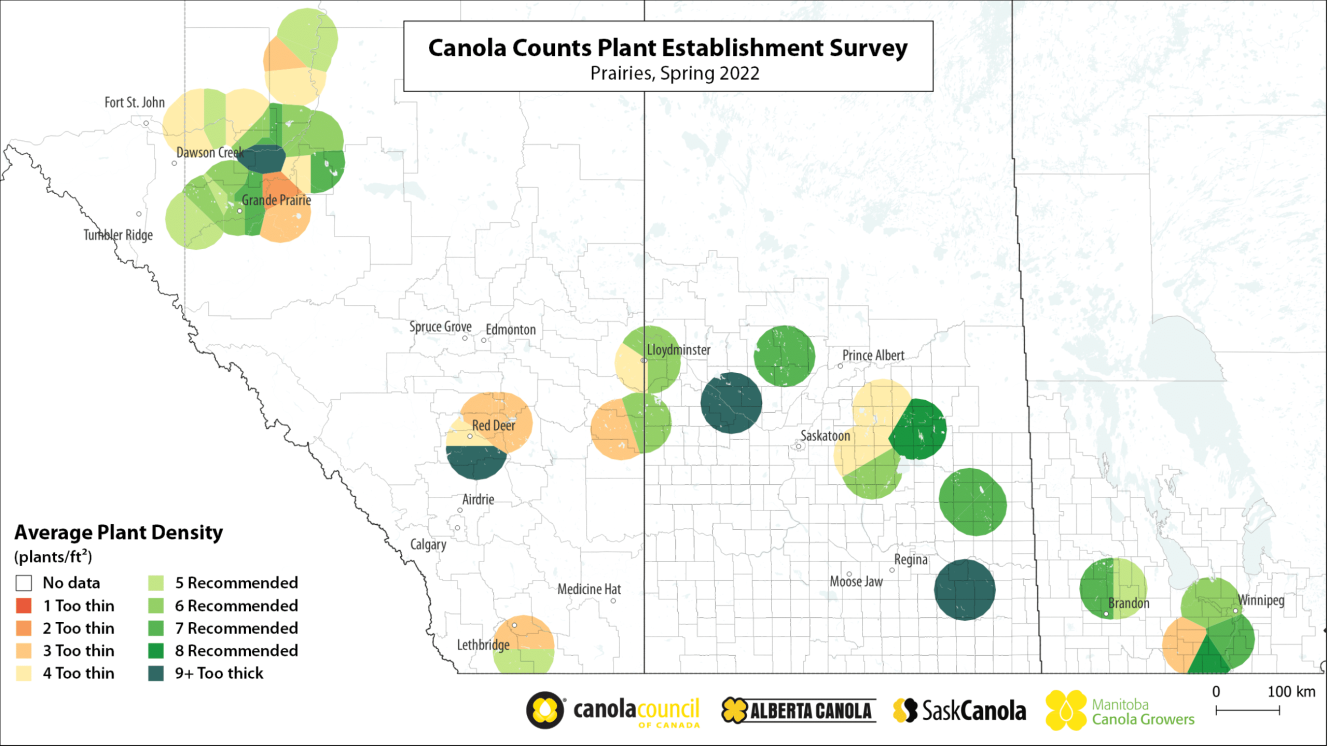
Prairie summary
These Canola Counts maps were created from crowd-sourced data collected in the 2022 spring through the Canola Counts survey tool at CanolaCounts.ca. If you’d like to see more data points within your region, be sure to enter your canola plant counts next spring and encourage your colleagues to do the same.
Emergence
Plant density
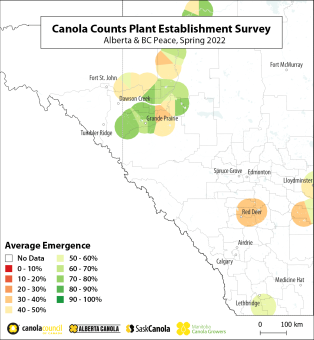
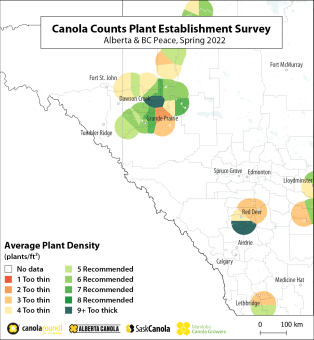
Alberta and B.C. Peace
This map includes depicts data submitted through the CanolaCounts.ca tool in the spring of 2022 from locations within the canola growing regions of Alberta and the B.C. Peace River.
Central and southern Alberta had below normal soil moisture conditions in the spring (April-May), while most of northwestern Alberta (northwest of Edmonton) had normal soil moisture and the Peace River region had above normal soil moisture. Average temperatures were several degrees below normal in Alberta from mid-April to mid-May, remained a few degrees below normal into early June.((Agriculture and Agri-Food Canada’s Science and Technology Branch. 2022. Maps of historic agroclimate conditions. Data provided through partnership with Environment Canada, Natural Resources Canada, Provincial and private agencies. Available online (accessed August 2022).))
These conditions led to delayed seeding and likely contributed to the slow growth and some plant establishment and development issues as well as variability in the stand, in the Peace River region. Delayed average crop stage and stand variability in southern Alberta in the spring may have resulted from the spring conditions and later than normal seeding dates.((Agriculture and Agri-Food Canada’s Science and Technology Branch. 2022. Maps derived from reports on agroclimate impacts. Available online (accessed August 2022).))
Reports of flea beetle feeding and some seedling diseases suggest insect and plant pathogenA disease-causing organism (such as a fungus or bacteria). More pressures also affected canola plant establishment throughout the province, as it usually does to some degree.
For more details on crop details, see the 2022 Alberta crop reports.
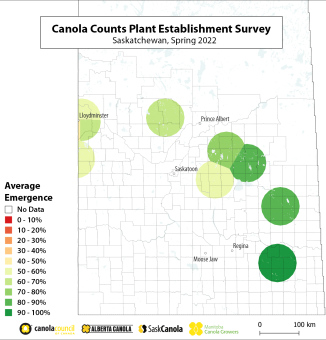
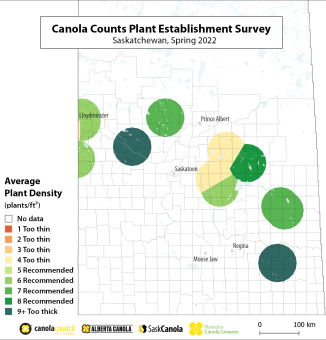
Saskatchewan
This map includes depicts data submitted through the CanolaCounts.ca tool in the spring of 2022 from locations within the canola growing regions of Saskatchewan.
Soil moisture estimations in early April varied across Saskatchewan, with generally higher amounts in the eastern than the western portion. By the end of May this difference in estimated soil moisture was accentuated when up to 200% of average precipitation fell in the eastern (especially southeastern) half of the province throughout April and May, while the western portion received below average moisture. Below average temperatures were reported from mid-April to mid-May, and to a lesser degree until mid-June. The higher moisture southeastern portion of the province having the coolest average temperatures (relative to normal) in the mid-April to mid-May period.((Agriculture and Agri-Food Canada’s Science and Technology Branch. 2022. Maps of historic agroclimate conditions. Data provided through partnership with Environment Canada, Natural Resources Canada, Provincial and private agencies. Available online (accessed August 2022).))
Similar to Alberta, this likely led to delayed seeding and delayed crop development (by up to two weeks in some areas), especially in the northern portion of the crop growing portion of the province.1 Variability of crop stages within fields as well as between them has been reported, and could have led to some plant establishment challenges.
Insect and disease pressures were also reported by growers, as well as weed pressure for growers that couldn’t achieve ideal weed management practices due to unfavourable weather conditions (ex. some herbicide applications weren’t made at ideal timing because of rain or wind event that came up).
For more details on crop details, see the Saskatchewan crop reports.
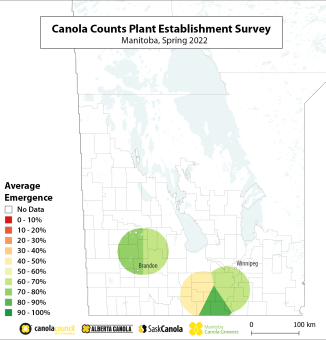
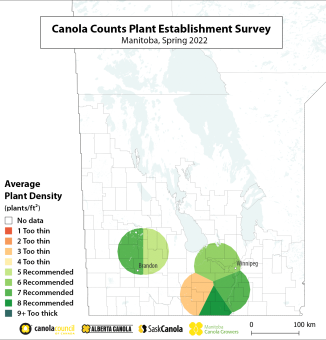
Manitoba
This map includes depicts data submitted through the CanolaCounts.ca tool in the spring of 2022 from locations within the canola growing regions of Manitoba.
In early April, much of Manitoba had estimated normal or above normal soil moisture conditions. Unfortunately, this was followed by two months (April – May) of an estimated 150-200% of average precipitation, which left the soil moisture estimations all across Manitoba well above normal by the end of May.((Agriculture and Agri-Food Canada’s Science and Technology Branch. 2022. Maps of historic agroclimate conditions. Data provided through partnership with Environment Canada, Natural Resources Canada, Provincial and private agencies. Available online (accessed August 2022).)) There was significant overland flooding in many parts of southern Manitoba throughout these months and even into early June, in some areas. The majority of the canola growing areas in Manitoba then proceeded to have well below average temperatures from mid-April mid-May, and to a lesser extent from mid-May until mid-June.((Agriculture and Agri-Food Canada’s Science and Technology Branch. 2022. Maps of historic agroclimate conditions. Data provided through partnership with Environment Canada, Natural Resources Canada, Provincial and private agencies. Available online (accessed August 2022).))
The combination of these temperature and precipitations is credited for the late seeding dates in most of Manitoba. It may have also contributed to the variation in growth staging within and between fields. Most Manitoban canola crops were reported to be two or more weeks behind normal development at the end of May, and in the south and southeastern areas of the province remain behind into the end of June.1
Flea beetle pressures were reported in Manitoba by many farmers in the spring of 2022, as well as some plant disease and weed pressures. Similar to Saskatchewan, it was reported that unfavourable weather conditions (ex. rain or wind events) at less than ideal timing led to many herbicide applications timing challenges (and potentially greater weed pressures than a typical year.
For more details on crop details, see the Manitoba crop reports.
2021 Spring
Prairie summary
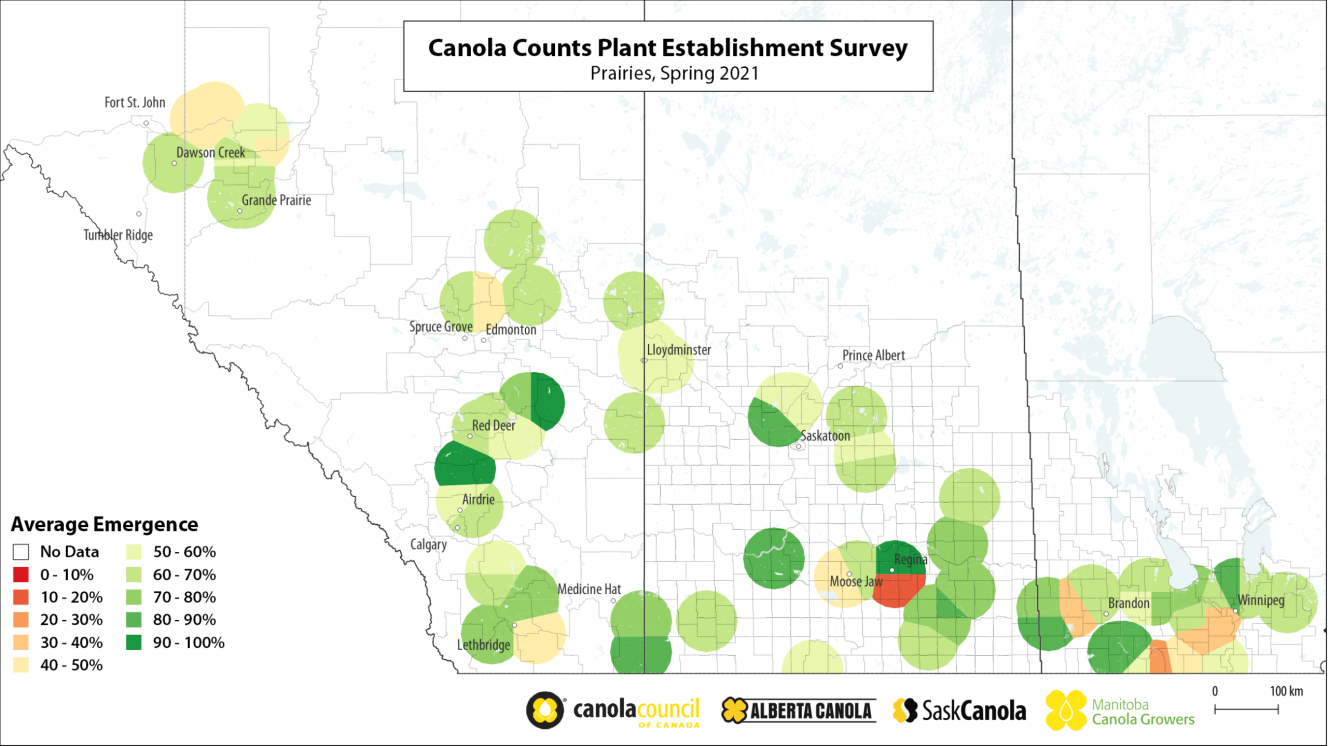
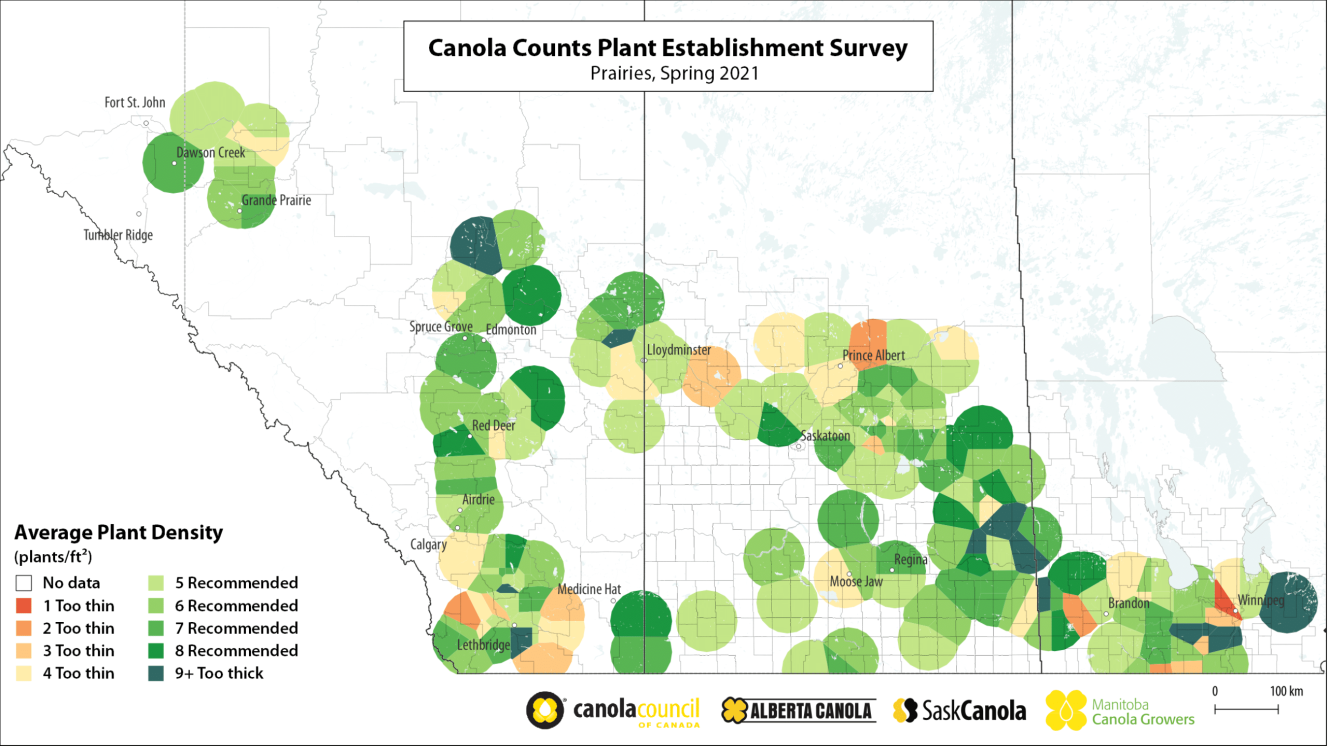
These Canola Counts maps were created from crowd-sourced data collected in the 2021 spring through the Canola Counts survey tool at CanolaCounts.ca.
Emergence
Plant density
Alberta and B.C. Peace
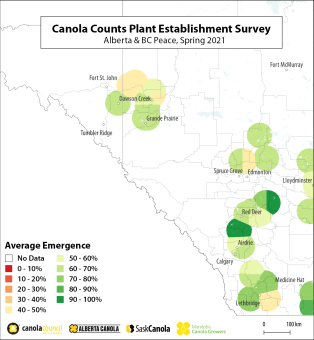
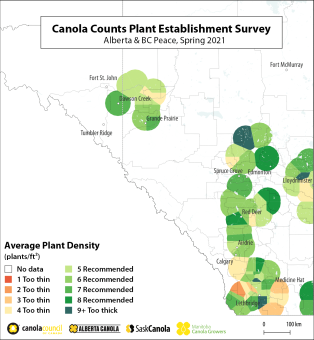
This map depicts data submitted on the CanolaCounts.ca tool from locations within the canola growing region of Alberta and the B.C. Peace River region (in the northeast corner of B.C.). Ensure your area is represented in future maps by entering plant (or stem) counts from your fields at CanolaCounts.ca.
While most of Alberta had low soil moisture reserves going into seeding in 2021, timely rains meant that many canola acres emerged with decent initial moisture. Frosts in late May and early June caused damage to recently emerged canola, though the earlier frost hit before actual emergence for many acres in the central Alberta and Peace River regions.
There appeared to be less spring flea beetle pressure in southern Alberta compared to previous years, though there were fields across the province that saw feeding damage above thresholds.
As spring progressed, dry conditions in the Peace River region and southern Alberta persisted, expanding to include much of central Alberta. The whole province saw exceptional heat and dry conditions after establishment which is expected to impact yield and time to maturity.
For more details on weather conditions in this region, see these Agriculture and Agri-Food Canada maps and for additional crop details, see the Alberta crop report.
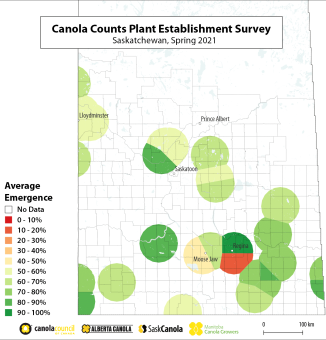
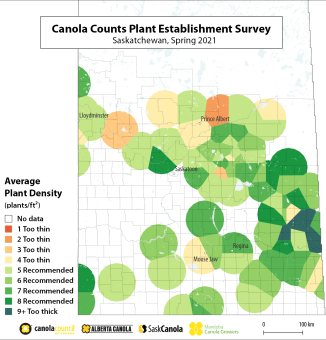
Saskatchewan
This map depicts data submitted on the CanolaCounts.ca tool from locations within Saskatchewan. Ensure your area is represented in future maps by entering plant (or stem) counts from your fields at CanolaCounts.ca.
Spring conditions in the canola growing region of Saskatchewan started with good soil moisture, but some areas experienced dry seedbed conditions. As a result, some growers increased seeding depth in an attempt to seed into moisture. Most areas received rain after seeding, some of which was rapid and forceful and caused emergence issues, especially for deeper seeded fields.
Overall numbers of spring flea beetles seemed to be lower than previous years, although there were still heavily infested pockets through the province.
The whole province saw exceptional heat and dry conditions after establishment which is expected to impact yield and maturity.
For more details on weather conditions in this region, see these Agriculture and Agri-Food Canada maps and for additional crop details, see the Saskatchewan crop report.
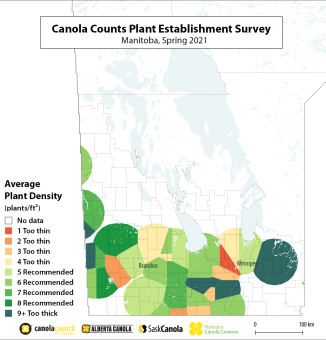
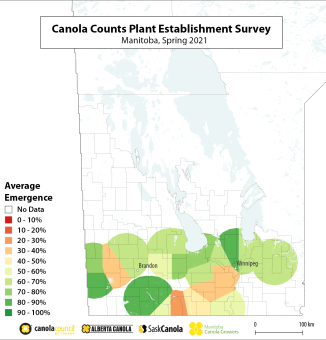
Manitoba
This map depicts data submitted on the CanolaCounts.ca tool from locations within Manitoba. Ensure your area is represented in future maps by entering plant (or stem) counts from your fields at CanolaCounts.ca.
A dry, open spring in in the canola growing region of Manitoba allowed farmers an early start on seeding. Dry conditions continued through most of May, along with cool soil temperatures, delaying canola germination and emergence. Farmers were left with the decision of whether to wait to plant their canola into warmer conditions or to seed deeper to place the seed into moisture.
A timely May long weekend rain across the province allowed for early seeded crops to emerge just in time for a severe late May frost. This frost event resulted in many acres being resown and created further variability amongst plant stands. Later-seeded crops emerged during an early June heat wave which saw temperatures well above 35oC. This heat, coupled with high winds and low soil moisture reserves, caused significant plant stress and slowed crop growth and development.
The slow growth and stress on the crop allowed for flea beetles to get a jump on the crop. Variable plant populations were seen across the province because of a combination of environmental extremes. For more details on weather conditions in this region, see these Agriculture and Agri-Food Canada maps and for additional crop details, see the Manitoba crop report.
- Agriculture and Agri-Food Canada’s Science and Technology Branch. 2022. Maps derived from reports on agroclimate impacts. Available online (accessed August 2022). [↩] [↩]