Farms can run their own research trials to test how a particular practice or product performs in the local environment. On-farm trials could test, for example, the difference between 60 pounds and 120 pounds of nitrogen fertilizer per acre, or between acres treated or untreated with fungicide. They can also evaluate the return on investment for novel products.
Basic steps for effective on-farm trials
Start with a simple plan
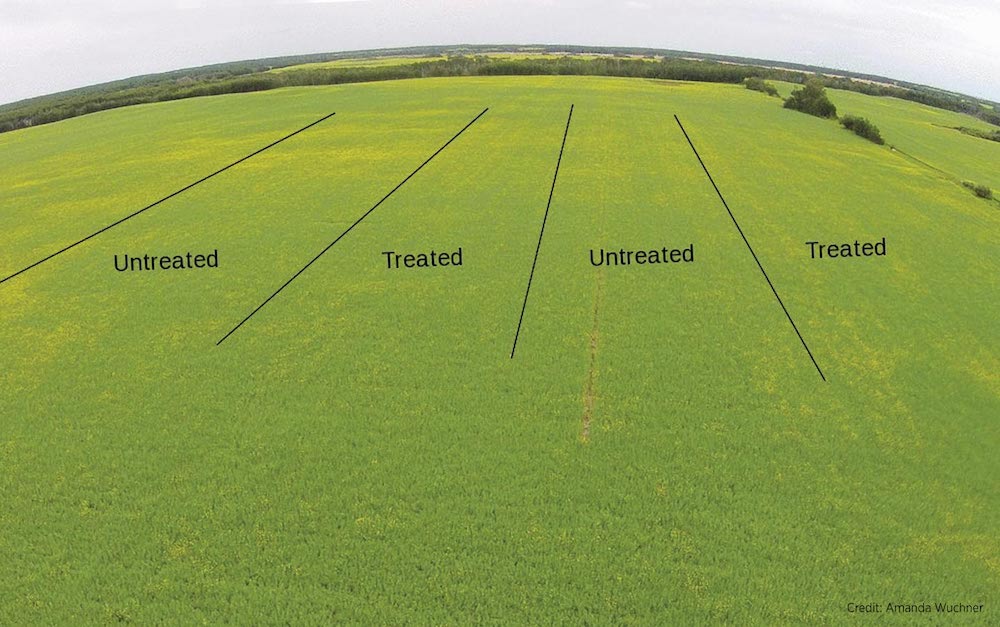
A two-treatment trial (new or treatment versus normal or untreated) keeps the trial simple. More treatments make the trial more complicated to plan and manage. A treatment could be the application of a product or the implementation of a type of practice (ex. a different rate, spacing, depth, speed, etc.).
Select the test area
Longer strips produce more reliable results. Aim for 750 feet or more. For strip width, have a treated width that is wider than the harvester (swather or combine) width. This will ensure that the area harvested keeps fully within the treatment area. Put strips of treated versus untreated crop in a uniform part of the field. If a uniform area is not possible, choose an area of the field that reflects the field as a whole. Note that complete uniformity is not possible, which is why the next step is important.
Replicate the strips
Try a few untreated strips (or check strips) and treated strips in the same block (four strips of each are ideal) within the same field. A check strip ensures differences in crop performance in the treatments are due to the treatment differences and not naturally occurring spatial variation. The further the check strip is from the other treatments, the less confident one can be that differences in treatment performance are real. Check strips should not be on field edges or areas that are not typical of the field. Read more in How to leave a check strip.
For a more accurate comparison, replicate these blocks in different areas of the farm and, ideally, in different years. Replication increases your confidence that differences between treatments are the result of the treatments, and not because of chance variation caused by differences in weather, soil and other factors.
Control other variables
If comparing a fungicide, for example, make sure the treated and untreated strips are the same variety, seeded the same day with the same tool, and follow the same practices for fertilizer, weed control and harvest. If it’s a fertilizer trial, have detailed soil sample results for the treatment area to rule out natural variation. That is another reason why multiple strips within a relatively uniform part of the field are important. Another consideration: If applying fungicide to a test area, spray perpendicular to the direction of seeding to ensure the same amount of wheel tracks throughout the trial. Apply product to the entire trial on the same day.
Weigh the results
Harvest all treatments on the same day. Cut through the middle of each strip to avoid edge effects and combine each row separately. Use a weigh wagon to get the most accurate yield data for each strip. Some farms have put scales on their grain carts. Measure the exact length and width of the strips. Make sure to empty the combine hopper after each treatment.
Keep notes
Record weather conditions, soil moisture, seeding date, pest pressures, harvest date, harvest quality and anything else you can think of. That will help create scenarios where a product may or may not work.
The Canola Council of Canada website has data collection sheets for nitrogen, seeding rate, seeding speed and variety (cultivar) comparisons available for use.
Get advice
Agronomists with experience in trials could provide help on set up, harvest and evaluation. Agronomists may also have weigh wagons or know how to get one.
Evaluate the results
A higher fertilizer rate or a fungicide treatment may produce higher yield, but it also needs to increase profitability, make life easier or reduce risk. To evaluate a return on an investment, one needs to know the average treatment response, expected crop price, and the cost of the treatment. Accuracy of the result will increase with more replications and site-years. Check out some result summaries from previous on-farm (field scale) research trials carried out through the Ultimate Canola Challenge program.
For a couple of simple statistical evaluation tools, enter weights for each strip into the Paired T-test calculator or try the Indian Head Agricultural Research Foundation (IHARF) data analysis tool.
The Canola Council of Canada website has more detailed tips for on-farm trials, including suggested protocols.