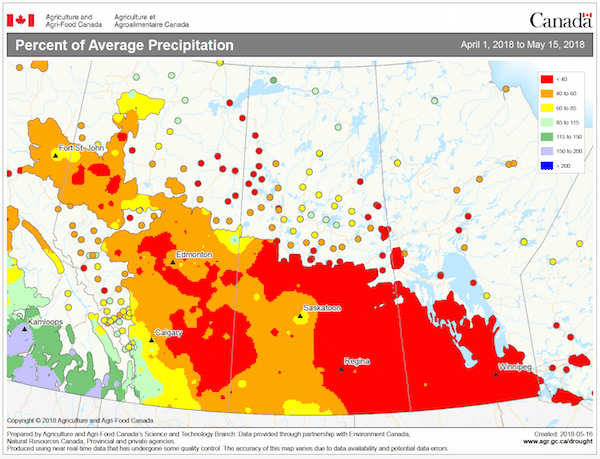
This map shows percent of average precipitation for April 1 to May 16, 2018. Areas in red have less than 40% of average. PDF version of map
Find this map and more at the AAFC AgroClimate Maps site.
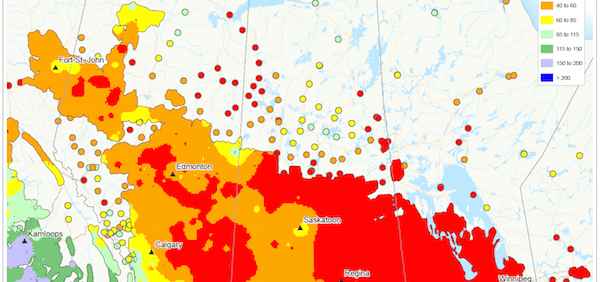
This map shows percent of average precipitation for April 1 to May 16, 2018. Areas in red have less than 40% of average. PDF version of map
Find this map and more at the AAFC AgroClimate Maps site.
Subscribe to Canola Watch and get the latest canola agronomic information delivered to your inbox weekly during the growing season.
Keep the conversation going. Ask a follow up question to an article, ask something new, or give us your feedback.
Follow Canola Watch as another way to get the latest canola updates.
Videos related to Canola Watch
Canola Watch Podcast
Past Canola Watch Issues
Canola Watch Resources
Canola Watch Quizzes