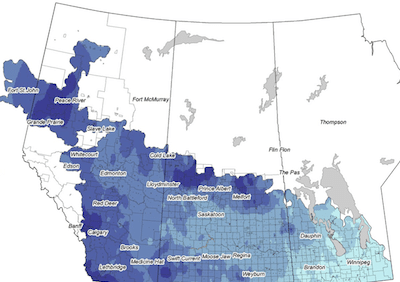
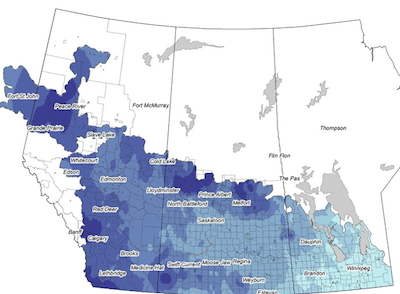
Here are two WeatherFarm maps. Click the map for a link to the original on the WeatherFarm site.
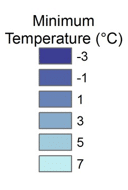
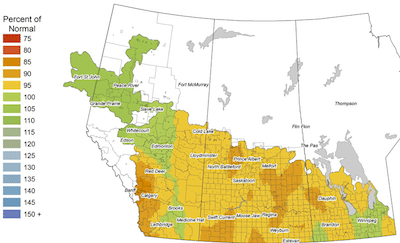
The frost map (top) is for yesterday morning. Many areas that had frost yesterday had frost again this morning. The second map, also from WeatherFarm, shows corn heat units (CHUs) for 2014 as a percent of normal. We don’t talk CHUs in canola, but this map demonstrates the variability in heat accumulation across the Prairies this year.