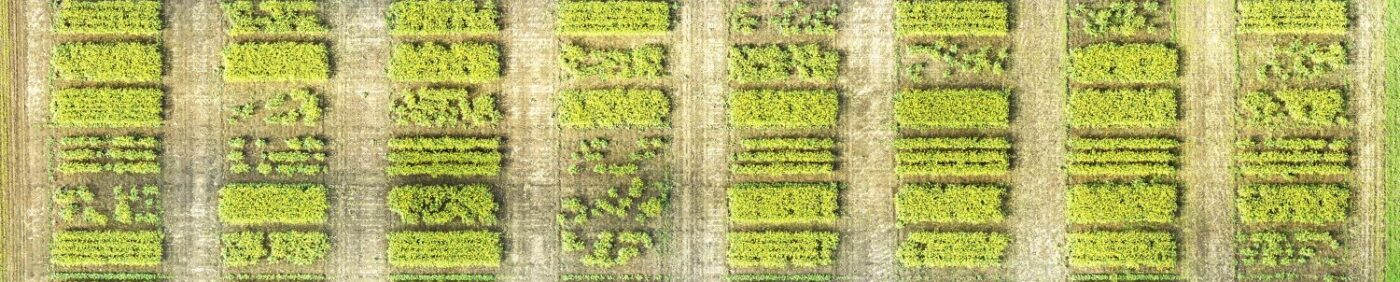
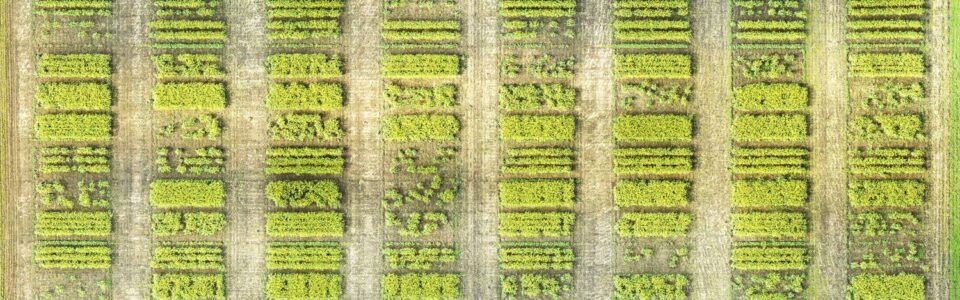
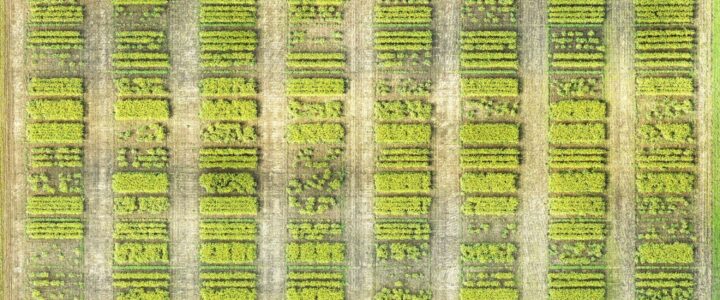
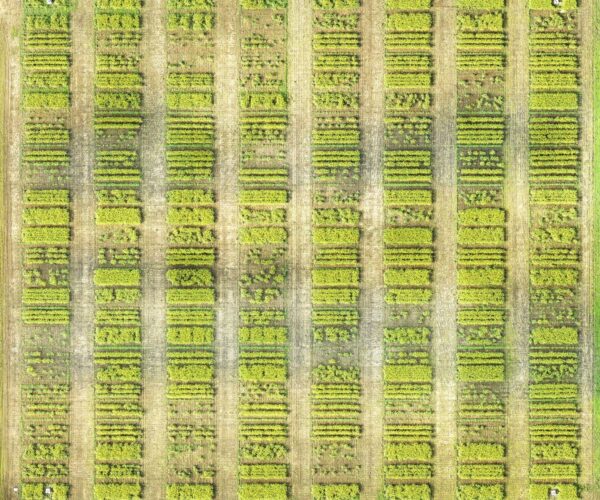
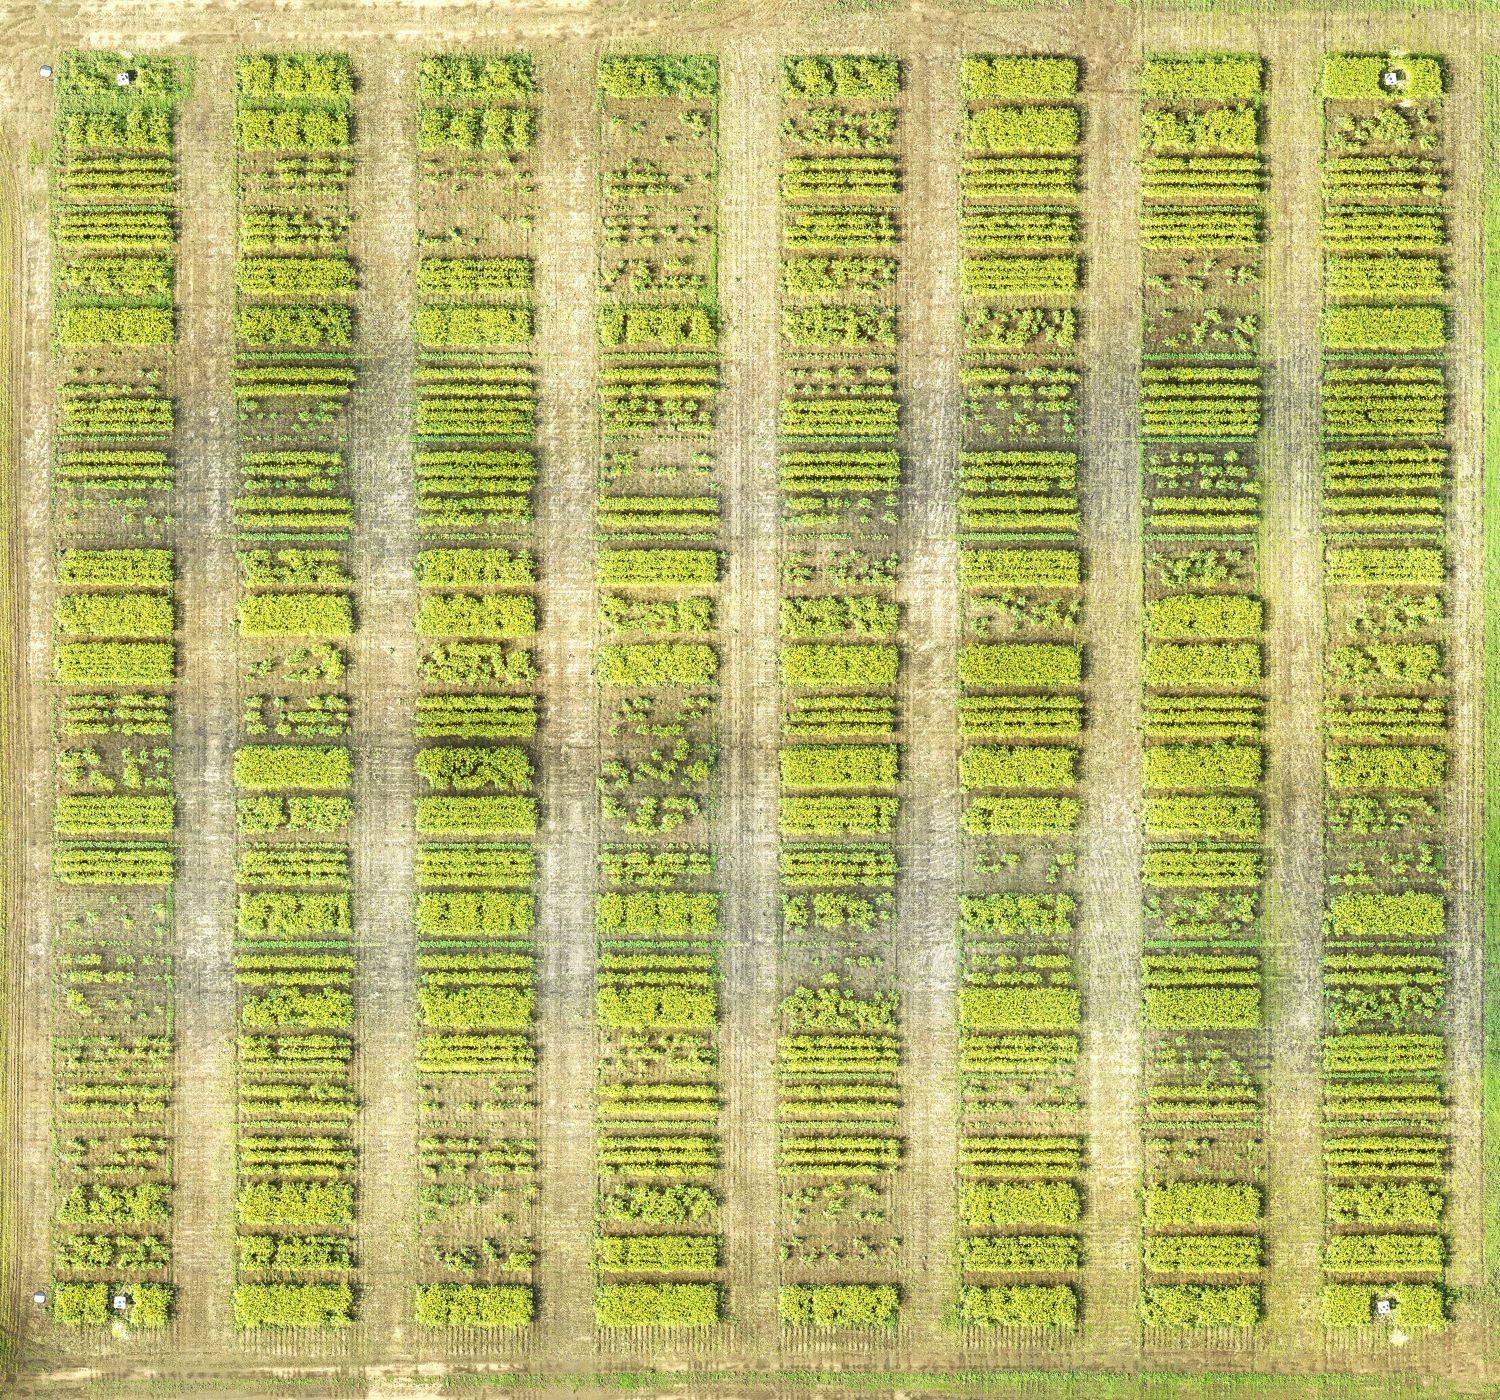
Photo credit: Shirtliffe research team
The Canola Council of Canada recommends targeting a canola plant population of five to eight plants per square foot is to balance yield potential and economics. The blog features recently completed research that examines this target and other plant population considerations.
To better balance seeding rate economics and yield-maximizing plant densities, Shirtliffe’s How does in-row seed spacing and spatial pattern affect canola yield? project investigated if the seeding rate could be reduced if seed arrangement was optimized.
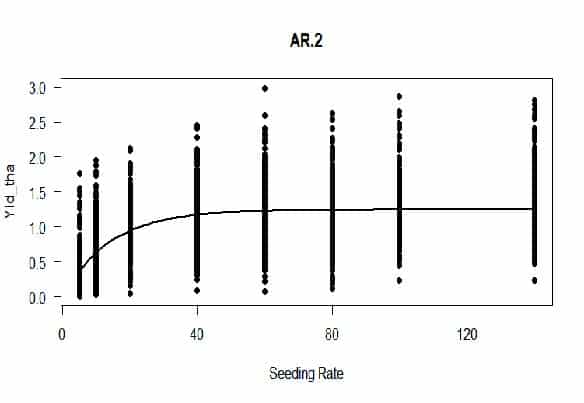
To do this, the research team compared six row spacing options (15, 30, 45, 60, 75, and 90 cm at the Saskatoon site and 19, 38, 57, and 76 cm at the Carman site) with eight different seeding rates (targeting 5, 10, 20, 40, 60, 80, 100, and 140 plants/m2) from 2019-2022. The Saskatoon site in the Dark Brown Soil Zone and has a semi-arid climate and the Carman site is in the Black Soil Zone and has a sub-humid climate. The drought and heat stress that occurred at both sites resulted in below optimal seed yield in canola and may have influenced the results. Despite these stresses and sub-optimal yields the research team believes the results are still valid as plant population effects often have greater proportional effects in dry years.
Since seed yield is a function of the number of plants, number of pods per plant, number of seeds per pod, and the seed weight, all of these components were measured, along with the number of branches per plant, plant biomass, and the start and end of flowering.
Apply this on your farm
- Establish 5 to 8 plants per foot2 and use row spacing of 30 cm (12”) or less to ensure rapid canopy closure and help maximize yield.
- Plan to use these plant establishment-supporting canola tools this spring.
- Watch this assessing plant establishment video.
- Listen to the Make every plant count podcast.
- Test yourself with this 4-question quiz
Seeding rate and row spacing results
The row spacing effect was minimal compared to seeding rate, however wider row spacings (>19 cm in Manitoba and >30 cm in Saskatchewan) always trended to lower maximum yields than narrower row spacing. More specifically:
Increasing (widening) row spacing above the recommended width:
- Had a significant impact on the end of flowering.
- Wide row spacing and low seeding rate delayed the start of flowering in plots and and prolonged the flowering period, which influenced harvest timing and the number of seeds obtained.
- Had no significant effect on plant biomass, number of pods per plant or the start of flowering.
- Has increased risk of reduced yields when crop emergence is low.
Increasing seeding rate above the recommended rate:
- Reduced the number of compensatory branches per plant, the number of pods per plant, plant biomass and plant weight (across all row spacings).
- Increased seed weight in one of two site-years, which could be attributed to environmental factors (ex. drought in 2018 growing season), and reduced seed weight in one of two site-years.
- Hastened the start and end of flowering (while low seeding rates generally delayed the start and end of flowering).
Therefore, wide row spacing and low seeding rates have the potential to reduce canola yield, despite having a prolonged flowering period. Seeding canola at narrow row spacing and high seeding rates can be optimal if overcrowding and crop competition are avoided to prevent limited crop development resources.
Planting arrangement results
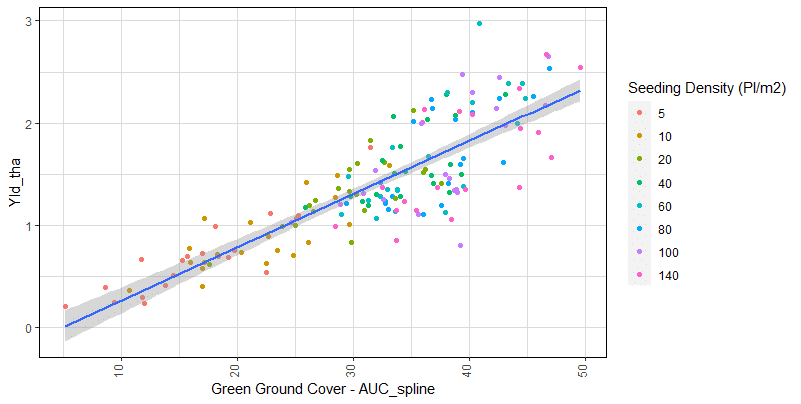
An examination into plant growth responses to planting arrangements through simulation modeling revealed that canola yield is highly associated with the space that the crop canopy occupies over time. The highest yielding treatments were the ones that most rapidly achieved and maintained full canopy coverage. While the reduced yield potential with low seeding rates and wide row spacings is due to the delay in full ground cover.
Since canola yield is not able to compensate for reduced ground cover from poor stands, agronomic practices such as optimal seeding rates and row spacings, that ensure rapid canopy closure, are necessary to maximize canola yields.
Conclusions and seeding recommendations
Canola yield is maximized when seeding rate and row spacing result in the longest duration of vegetative ground cover. Based on the analysis completed, seeding at least 60 seeds/m2 or 5.5 seeds/ft2 to establish 5 to 8 seedlings per square foot (in alignment with existing recommendations) and using row spacing of 30 cm (12 inches) or less can help achieve maximum yield.
Read more on the summary page and in the Final report.
Related plant stand research
This research builds on previous seeding rate and plant population research, including:
- Shirtliffe’s Determining the optimum plant density in canola research, which recommended canola farmers seeking to maximize returns should target populations greater than 50 plants/m2 (5 plants/feet2), as reducing seeding rates have a greater risk of having lower populations which can result in large yield losses.
- Hartman’s Canola plant establishment meta-analysis which reported that canola plant populations (in farm field surveys completed during provincial weed surveys around the time of this analysis) were below the economically optimal canola densities of 62–73 plants/m2, considering average prices at the time of the analysis, seed size, and emergence rates.
- Kirk’s Response of canola to low plant populations and evaluation of reseeding options found that reseeding is more likely to provide an economic benefit when the plant population is below 20 plants/m2 (2 plants/feet2), when the timing is early June at the latest, and when growers reseed to the same or a similar hybrid.
- Catellier’s Optimal seeding rate based on seed size in canola project concluded that the least risky seeding rate to achieve adequate plant stand population is about 10 seeds per square foot because the response to seeding rate differed between hybrids and seed sizes.
- Beres’ Manipulating agronomic factors for optimum canola harvest timing, productivity and crop sequencing reported that seeding rates of 120 and 180 seeds per square metre, which achieve 56 and 80 plants per square metre (five to eight plants per square foot), respectively, generally provided higher and more stable canola yield relative to the seeding rate of 60 seeds per square metre.
- Catellier’s A meta-analysis of small-plot trial data to examine the relationship between crop development and environmental conditions in canola reported that seeding rates may need to be increased to maximize yields when seeding at a later seeding date, when high average temperatures or low precipitation are observed before seeding, or expected after seeding.
- Coles’ Seeding between the lines: evaluating the potential of inter-row seeding for canola in southern Alberta research noted that seeding on-row significantly reduced plant stand establishment in canola compared to seeding between the row and with no attempt of alignment.
- Leeson’s Impact of management and environment on canola establishment based on survey data found that some canola growers are losing yield potential by underestimating plant stand densities.
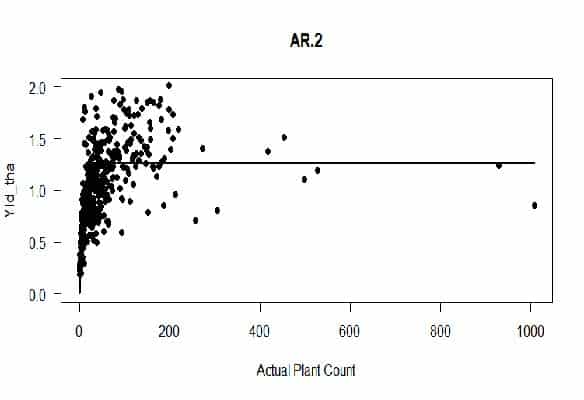
- Gan’s Farm gate investigation of best management practices in canola establishment and production systems highlighted that growers should take note of typical survival in their regions, and adjust their seeding rate accordingly to achieve the target plant stand since actual plant density is a better judge of canola productivity than seeding rates.
Resources to support optimal plant densities
Minimize your risk and maximize your profit with these three plant establishment-supporting canola tools
Canola Watch podcast Ep. 71 – Make every plant count
Published January 31, 2024