When reviewing information from the past season (ex. yields, soil test results, field notes) and planning for the next year (ex. finalizing rotation plan, seed purchases and nutrient plans), be sure to reference the studies below for added insight. The Canola On-Farm Research Program now has a second year of values to add to the Manitoba dataset and to better inform the resulting preliminary conclusions for your consideration. As well, the long awaited Revised crop nutrient uptake and removal guidelines for Western Canada are available to provide more updated recommendations about the nutrient amounts in your soils.
Are nitrogen rates in Manitoba optimizing yield and nitrogen efficiency?
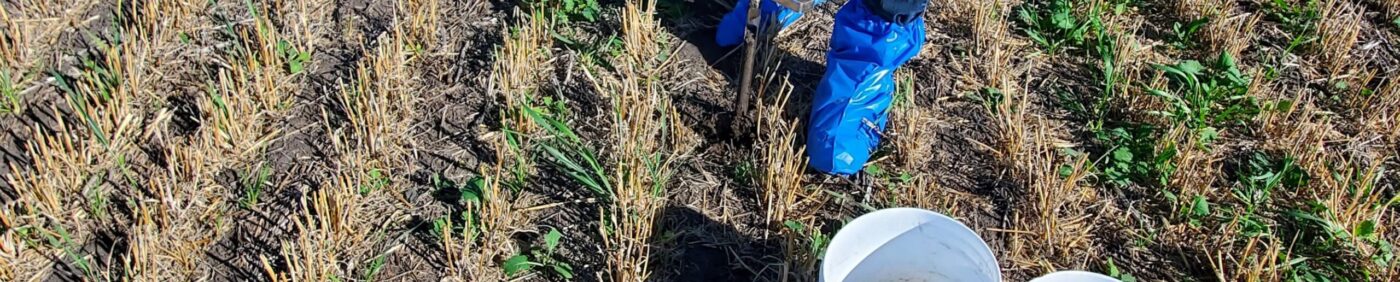
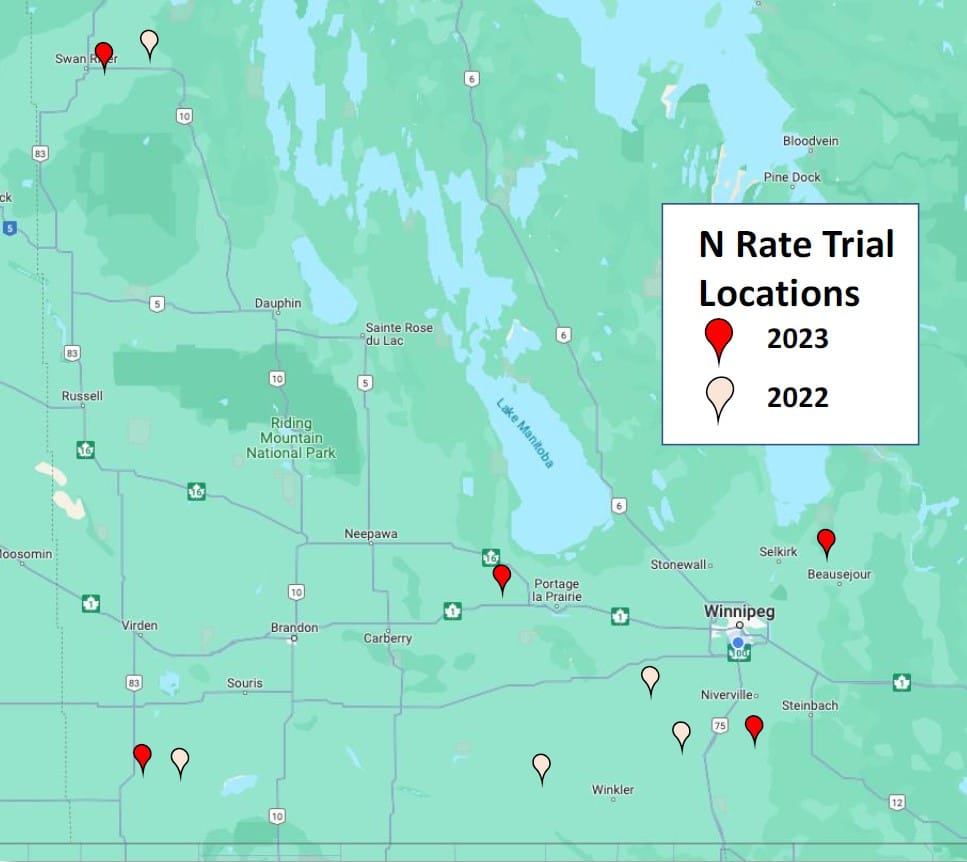
The Manitoba Canola Growers’ On-Farm Research Program worked to address this question by adding five more locations in 2023 to the five 2022 on-farm trial locations. As mentioned in the report, these sites compared three nitrogen rates: reduced, standard and high , which were 75%, 100% and 125% of the rate that was usually used on the field. Each treatment was one equipment width x field length, with four replicates per treatment (totaling 12 strips per location). In addition to calculating yields, they also took plant counts, tissue nitrogen samples (at bolting), protein and oil content for each strip.
Preliminary yield results
Considering individual location data (from 2022 and 2023), seven of the ten locations had lower yield values with the reduced rate (compared to the standard rate), including two locations with significantly lower yields (of -4.2 and -5.3 bu/ac). Eight of the ten locations reported higher yield values with the high rate compared to the standard rate, including one significantly higher yield (of 3.9 bu/ac). When data from all locations was considered together, a significant (1.6 bu/ac) increase in yield was reported for the 125% rate compared to the standard (100%) rate.
Apply this on your farm
- Calculate and compare your nitrogen efficiency.
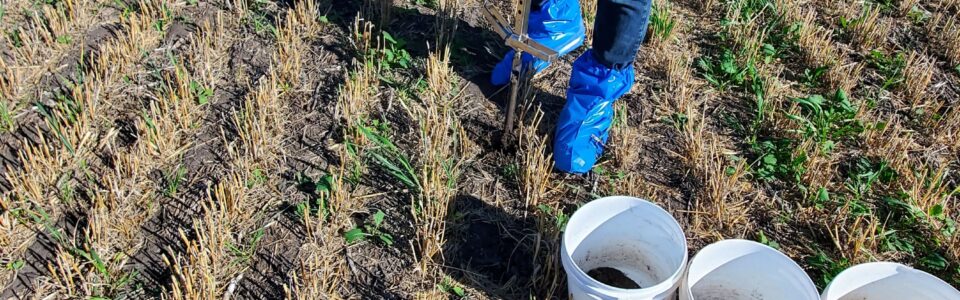
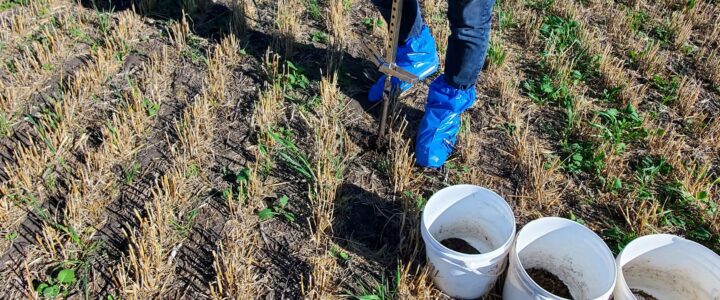
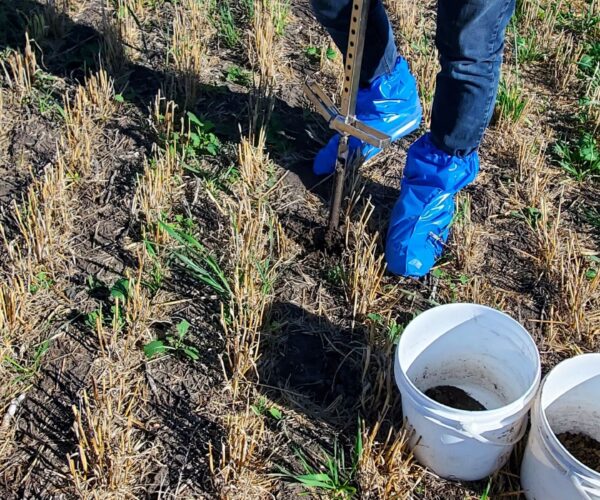
- Soil test regularly to assess current soil nutrient status.
- Use the fertilizer efficiency calculator to compare 4R strategy efficacies.
- Ensure sufficient sulphur is part of canola nutrient management plans.
- Use the Prairie Nutrient Removal Calculator in your nutrient management planning.
Range in nitrogen fertilizer efficiency
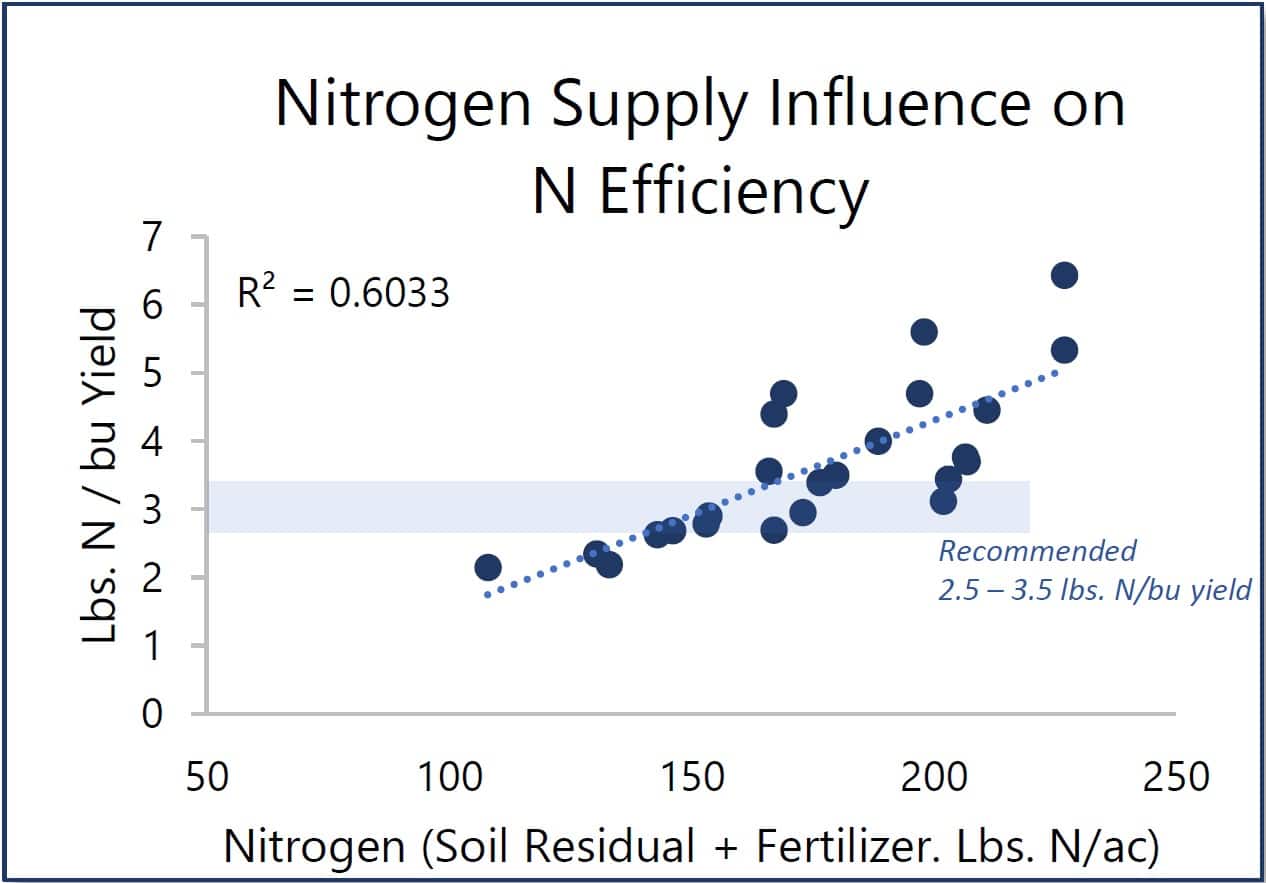
As noted in the report, an increase in grain yield of 1.6 bu/ac for could be sufficient to cover the added cost of 32 lbs. N/ac (at $0.76 lbs. nitrogen and $16 canola). However economics vary between farms (ex. price of buying nitrogen fertilizer, price to sell canola at and standard nitrogen application rates), the economics of the increased applications (and potentially higher yields) also need to offset the reduced nitrogen fertilizer use efficiency that was reported in this study at greater amounts of nitrogen (pounds of nitrogen per acre of nitrogen fertilizer plus soil residual nitrogen) provided to the crop per bushel of grain produced, or lbs. N (soil + fertilizer).
The recent Manitoba recommendation is to provide canola with 2.5 to 3.5 pounds of nitrogen (soil + fertilizer) per bushel of yield targeted. With a range of 2.4 to 5.6 lbs. N (soil + fertilizer), many of the sites in this study fell within this recommendation, but some were outside of it. The general reduction in nitrogen use efficiency at increased fertilizer rates makes the economics of the scenario even more important. Ensuring the correct soil nitrogen levels were used with effective soil testing is also key for an accurate account of nutrient levels. For more on this, and how updated crop nutrient uptake and removal values in Manitoba could impact decisions about managing nutrient banks for nitrogen and all other macronutrients, see John Heard’s Manitoba Agriculture poster ‘Updating Values of Prairie Crop Nutrient Uptake and Removal: Part 1‘) which uses a subset of the Western Canadian dataset used in the Revised crop nutrient uptake and removal guidelines for Western Canada project.
Individual sites and additional trials
More details on this trial and the individual locations (including plant counts, tissue nitrogen, grain moisture, nitrogen efficiency and more) are available in the 2023 Canola On-Farm Research Program Report on the Manitoba Canola Growers website.
The preliminary results from the canola seeding rates trials and the canola seed-placed fertilizer trials in Manitoba Canola Growers’ On-Farm Research Program are also available in the report. This study will continue in 2024 and 2025.
Saskatchewan on-farm trials
SaskCanola is administrating on-farm trials in Saskatchewan. The objective of the 2023 field-scale trial was to determine if farms can see agronomic and economic benefits from applying nitrogen-fixing bacteria product in wheat or canola. Producer-cooperators will determine the value of utilizing this product under the typical management practices and environmental conditions of their operation. The results from this pilot year will be published in February 2024.
Revising the crop nutrient uptake and removal guidelines for Western Canada
In addition to soil testing, nutrient uptake and removal guidelines are an integral part of 4R fertilizer management practices and provide farmers and agronomists with more information on crop nutrient requirements. This can be used to help balance the nutrients removed when the grain is harvested with the nutrients added as fertilizer, helping to ensure consistently high yield goals in alignment with economic goals and sustainable cropping systems.
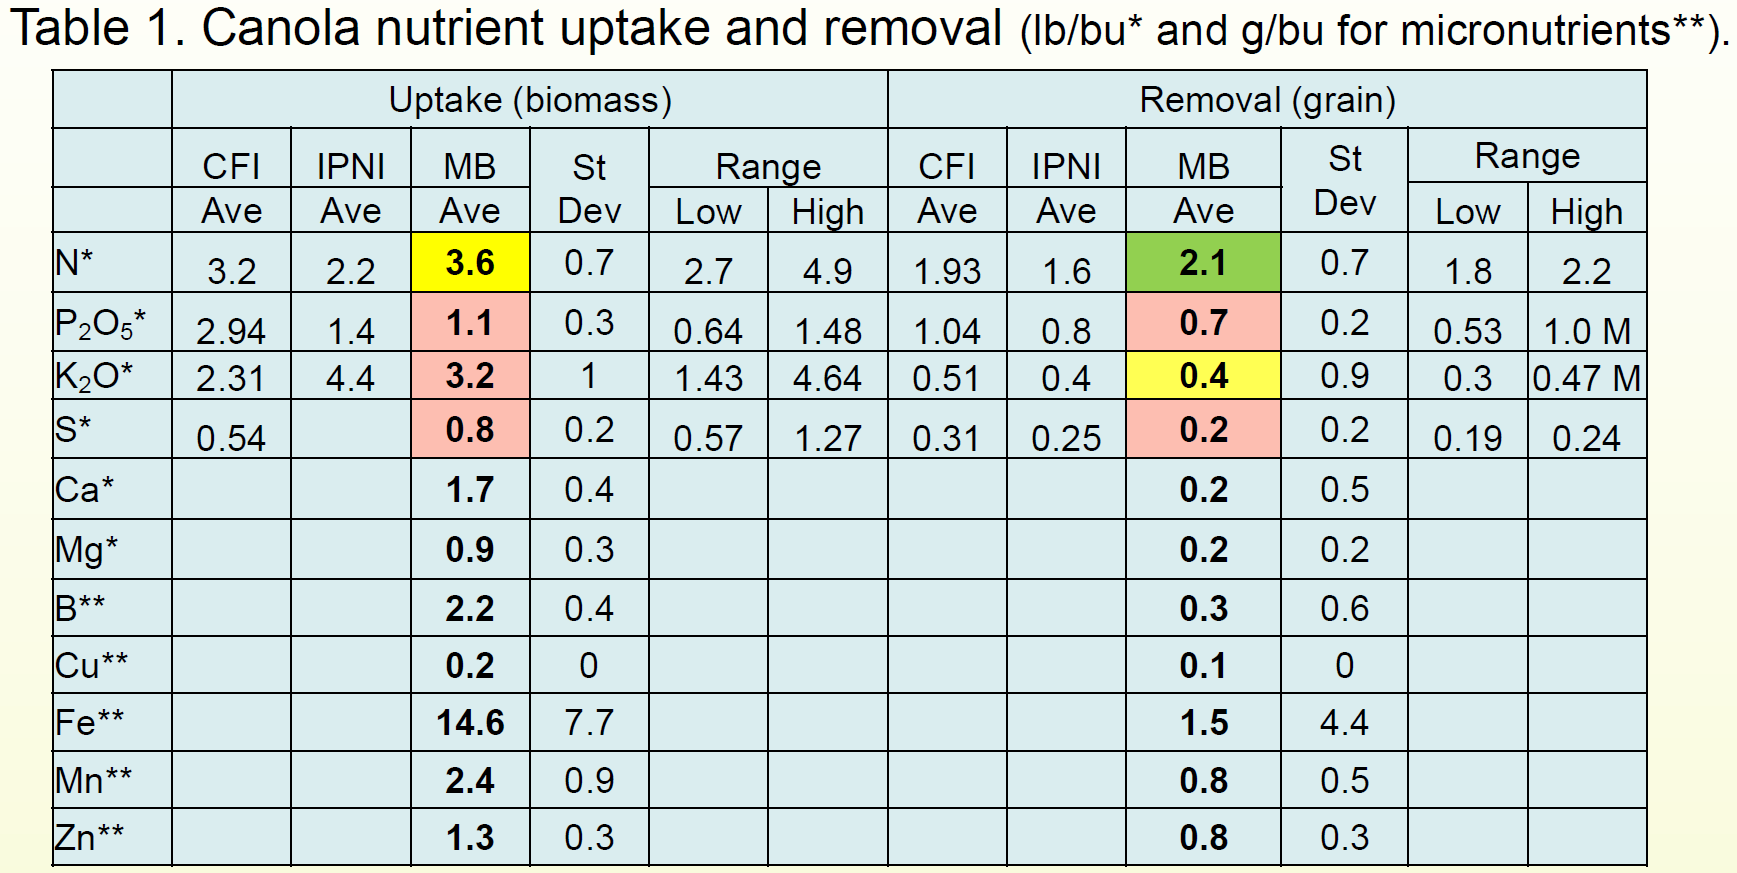
Since existing guidelines are not specific to Western Canada or were developed prior with data prior to 2000, there was a strong need to revise the crop nutrient uptake and removal guidelines for Western Canada. Building on previous guidelines, the revised values for Western Canada include removal and uptake estimates for both macro (N, P2O5, K2O, S) and micronutrients (Cu, Zn, B) for 14 annual (including canola) crops based on both measured values from seed and straw samples. This research, led by Dr. Fran Walley, is especially important with high fertilizer prices and the increased interest in understanding micronutrients, particularly as crop yields climb.
New nutrient uptake and removal values
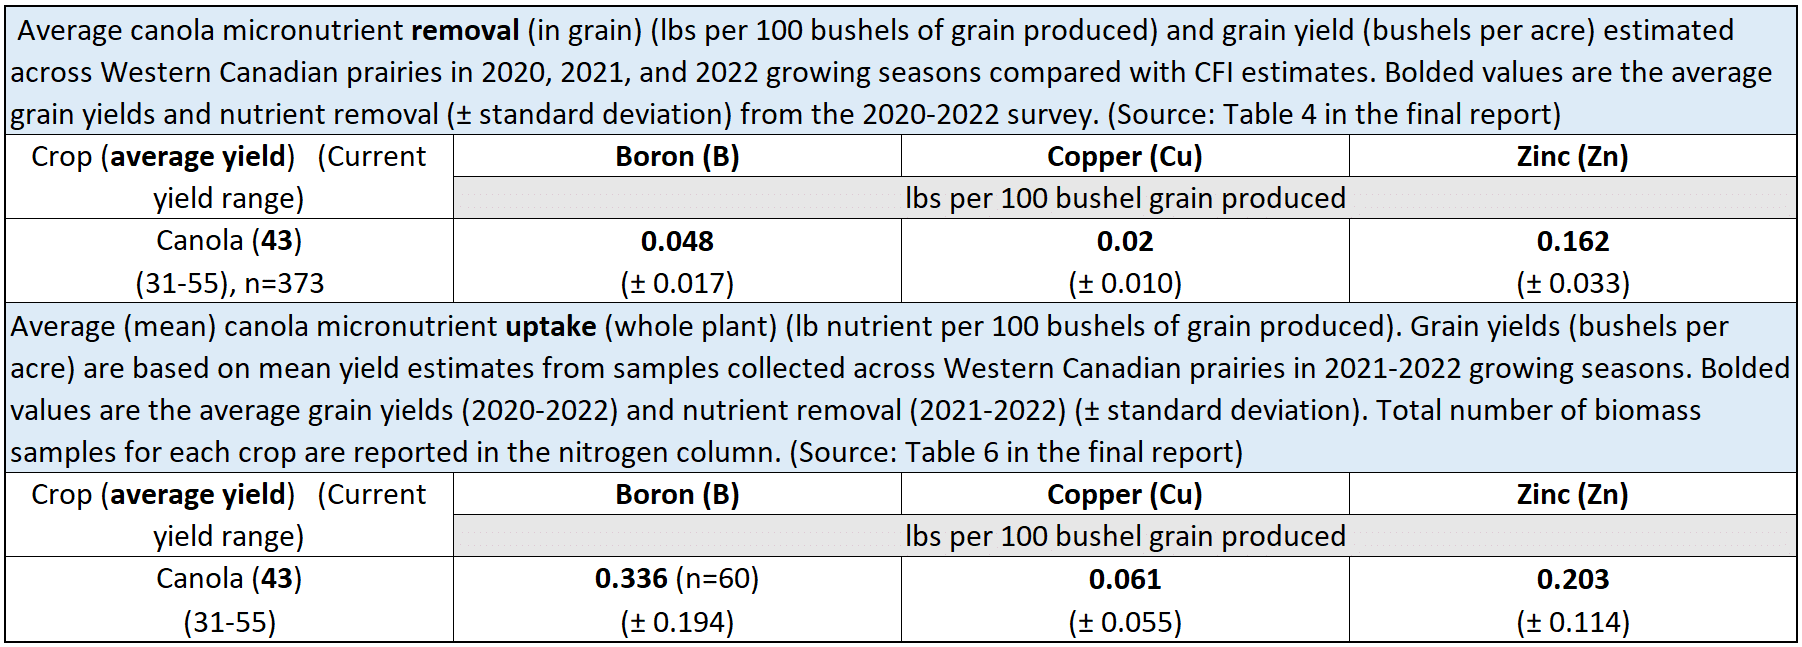
Over 2200 grain and biomass samples were collected from across the three Prairie provinces from 2020 to 2022, and analyzed for macronutrient and micronutrient uptake (total nutrient uptake in harvested grain and residue straw portions), based on analyses of grain and biomass samples collected from commercial fields and values from existing literature.
As noted in the final report, some of the nutrient uptake and removal values are aligned with existing estimates (e.g., CFI Nutrient Uptake and Removal Guidelines for Western Canada, 2001) whereas others needed revision. The existing ranges of nutrient removal didn’t capture the full extent of the observed variability in nutrient uptake and removal, highlighting the importance of using any uptake and removal estimates together with regular soil testing for informing fertilizer management decisions. The new uptake and removal estimates for micronutrients (boron, copper, and zinc) that this study provided was also very useful.
Nutrient removal rates were generally similar or lower in the 2001-2021 literature on nutrient uptake (biomass and straw) and removal (grain) from studies and raw data from across Western Canadian prairies (but this was mainly small-plot data) compared to survey data. One exception to this was sulphur (S) removal in canola. The average survey estimate was 0.19 lbs. S/bu canola, the literature-based estimate was 0.42 lbs. S/bu. Given the importance of sulphur in canola production, and the variance in the estimated removal, the researchers decided to opt for a higher removal estimate to avoid potential deficiencies.
Balancing the nutrient bank
Key messages highlighted in the final report are:
- Regular soil testing is a critical tool to assess current soil nutrient status and determining appropriate fertilizer application rates to achieve crop yield goals.
- These updated uptake and removal estimates are meant to assist as supporting information when developing fertilizer management plans, not be prescriptive or replace soil testing.
- The large variation in uptake for both macro and micronutrients in this survey data exemplify the variation that exists in commercial fields.
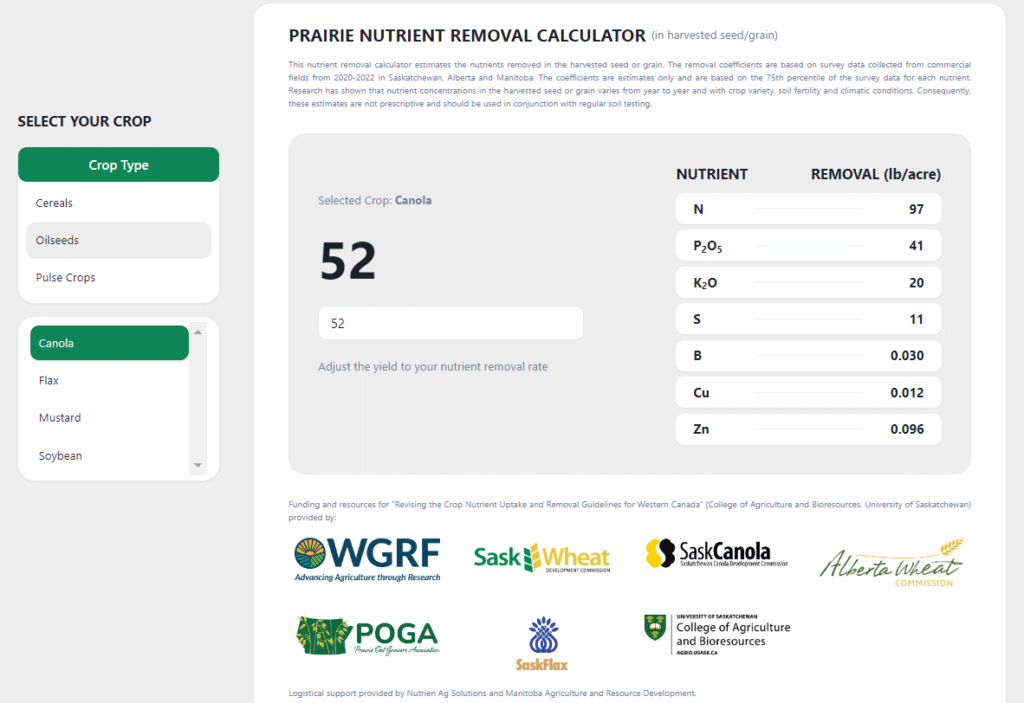
- Try out the new Prairie Nutrient Removal Calculator to estimate the nutrients removed in the harvested seed or grain.
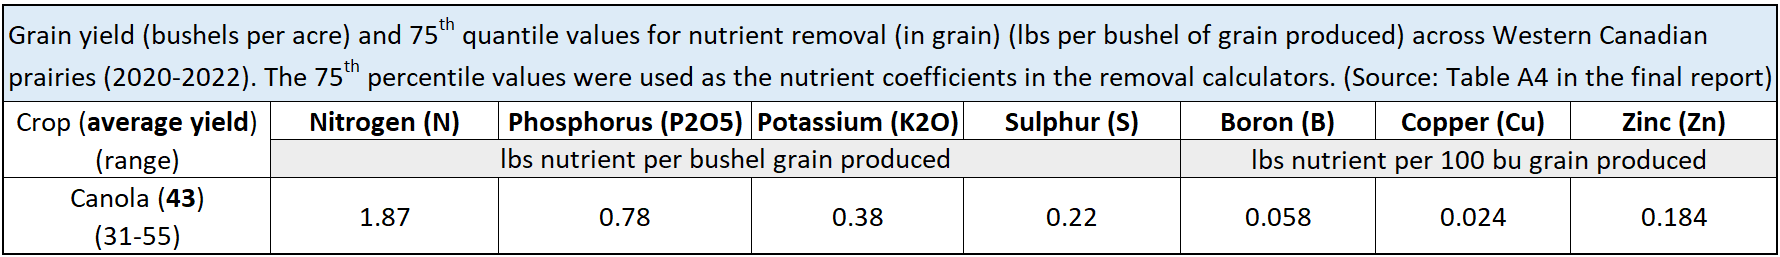
- The tool uses the 75th percentile, which is the value at which 75% of the observed survey nutrient uptake data fell below this value, and 25% of the observations were above this value. By selecting the 75th percentile for the coefficient, the calculator is more likely to overestimate crop nutrient removal than to underestimate it.
- Nutrient removal estimates help assess nutrient addition required to maintain or build soil fertility levels. But crops are not able to extract all the total nutrient available in the soil, so estimates of available nutrient(s) should be greater than estimates of nutrient removal to maintain soil nutrient levels.
- Total nutrient uptake and removal levels are also dependent on crop yield and can be affected by crop varieties, soil fertility, weather-associated variability, and general growing conditions.
- Although the survey data indicates lower sulphur removal by canola (and flax seed) than previous estimates, it is best to use a higher estimate of sulphur removal than suggested by the survey data to avoid potential deficiencies, given the importance of sulphur to canola production, and the variance in the estimated removal.
- For some crops and nutrients, lower grain concentrations suggest management practices and modern varieties have resulted in improved nutrient use efficiency on a per bushel basis, although higher yields remove more nutrient on a per acre basis.
- Manitoba recently released a fertilizer efficiency calculator to help producers and agronomist compare the efficacy of different 4R strategies for enhancing fertilizer use efficiency.
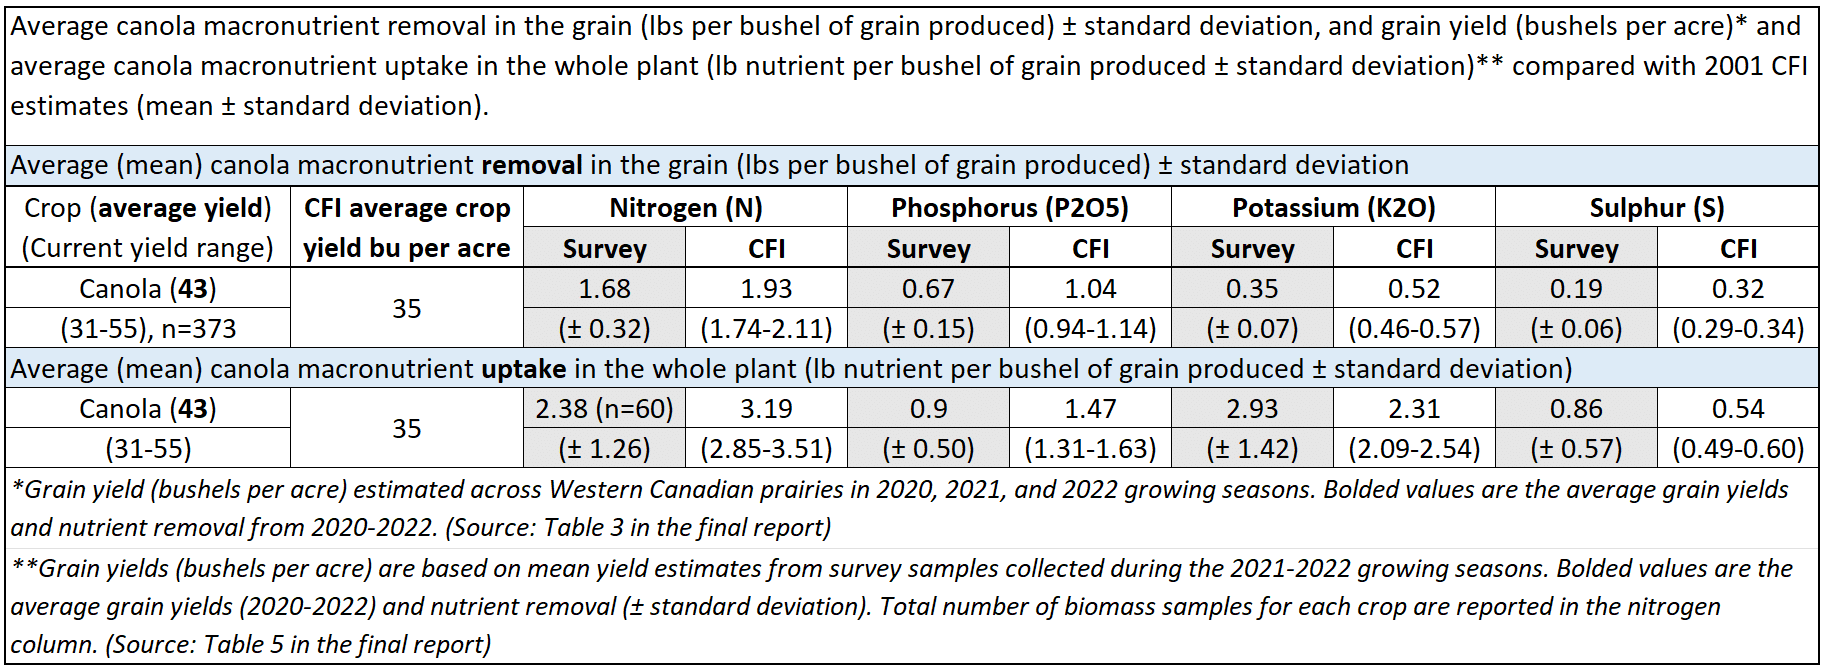
Check out how these findings are being implemented into canola production practices in the CCC’s Why should nitrogen get all the buzz? release, which features the summary table below:
| New guidelines (2023) | Old guidelines (2001) | ||||||
| Uptake | Removal | Uptake | Removal | ||||
| Pounds of nutrient per bushel of crop | |||||||
| Nitrogen (N) | 2.38 (±1.26) | 1.68 (±0.32) | 3.19 (2.85-3.51) | 1.93 (1.74-2.11) | |||
| Phosphorus (P2O5) | 0.90 (±0.50) | 0.67 (±0.15) | 1.47 (1.31-1.63) | 1.04 (0.94-1.14) | |||
| Potassium (K2O) | 2.93 (±1.42) | 0.35 (±0.07) | 2.31 (2.09-2.54) | 0.52 (0.46-0.57) | |||
| Sulphur (S) | 0.86 (±0.57) | 0.19 (±0.06) | 0.54 (0.49-0.60) | 0.32 (0.29-0.34) | |||
Published December 22, 2023; updated February 13, 2024