Key Result
The nutrient uptake and removal guidelines for crops in Western Canada are updated. Researchers discovered considerable variability in uptake and removal due, in part, to known differences in weather and management. Thus these estimates are to be used as guidelines only, not prescriptions.
Project Summary
Overview
Access to current nutrient uptake and removal data is invaluable when making critical cropping decisions such as fertilizer inputs, or even crop rotation decisions. Western Canadian agronomists and farmers have used the nutrient uptake and removal guidelines to inform these decisions, but there was a need to review and update these guidelines as needed.
In revising the nutrient uptake and removal chart for crops grown in Western Canada, researchers discovered considerable variability in uptake and removal due, in part, to known differences in weather and management. Thus these estimates are to be used as guidelines and should not be viewed as prescriptive.
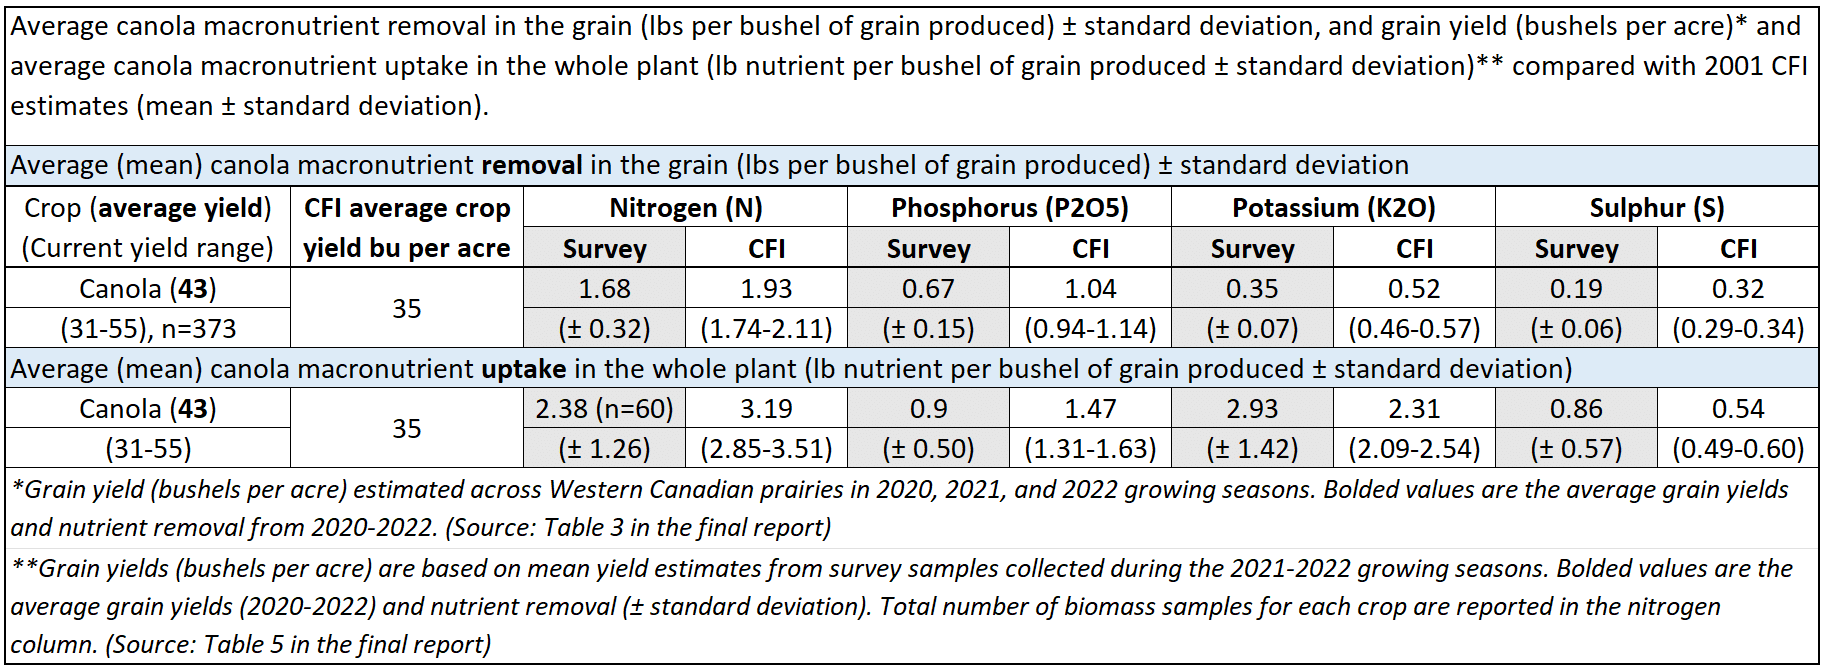
The nutrient uptake and removal guidelines for crops in Western Canada were last revised in 2001 by the Canadian Fertilizer Institute (CFI). This project aimed to develop new nutrient uptake and removal guidelines for 14 annual crops grown in Western Canada, based on measurements taken from straw and seed samples. The new measured estimates were also compared to published and unpublished literature from Western Canada.
Objectives
- Determine and revise estimates of the nutrient uptake and removal of crops commonly grown in Western Canada.
- Develop a user-friendly on-line and mobile app for determining nutrient uptake and removal estimates.
Results
The study was conducted from 2020-22, analyzing grain and biomass samples for nutrient content. Biomass collection occurred in 2021 and 2022 only because of COVID-19 restrictions in 2020. Limited samples for both seed and biomass were collected in 2021 because of the prairie-wide drought. However, this gave researchers the opportunity to assess how nutrient uptake and removal were affected by drought. By comparing grain samples collected in 2021 with those collected in 2020 and 2022, it was determined that although drought impacted crop yields, the removal and uptake (on a pounds per bushel basis) remained relatively unaffected by drought conditions beyond the variability that was associated with “normal” years.
The 14 crops studied included barley, corn, durum, oats, spring wheat, winter wheat, canola, flax, soybean, mustard, chickpea, dry bean, lentil and field pea. Faba bean was added because samples were available and seeded acres had increased.
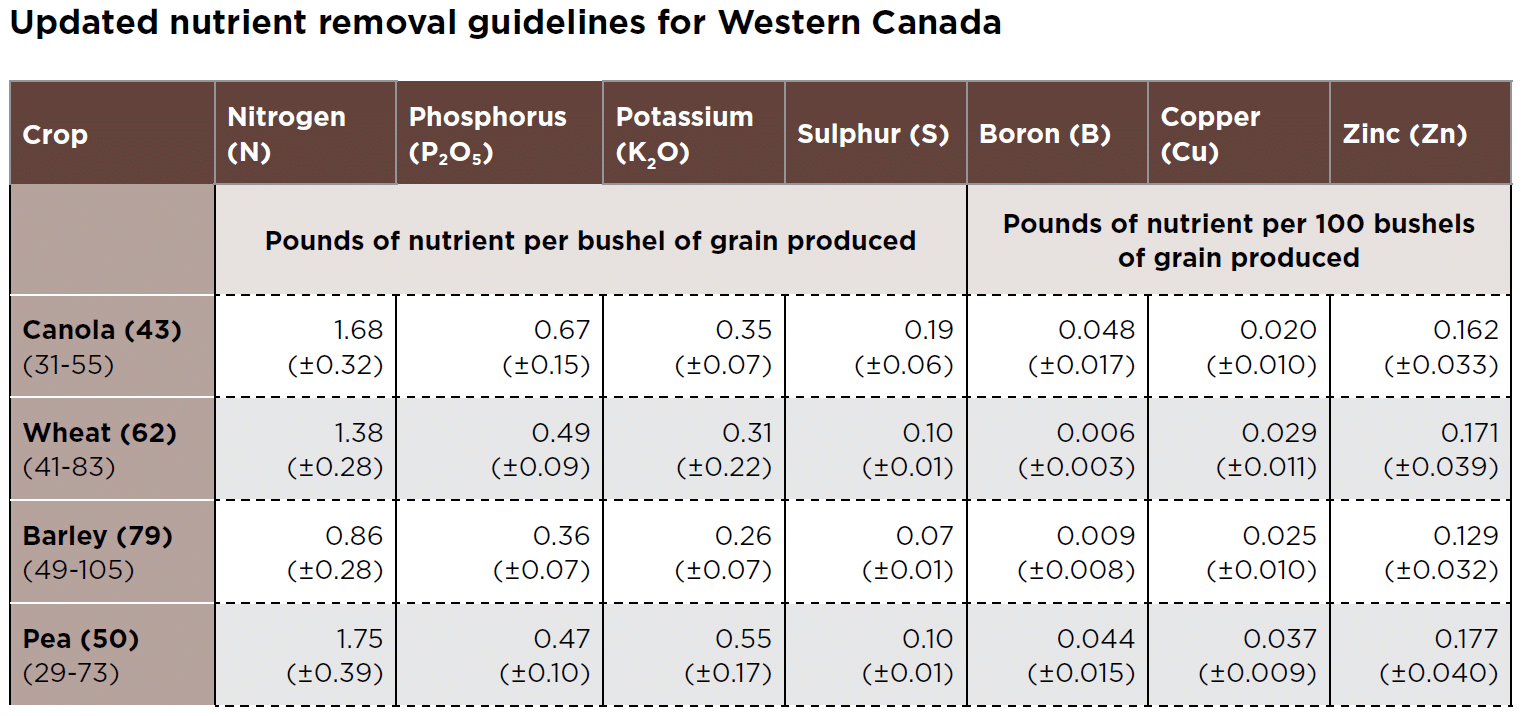
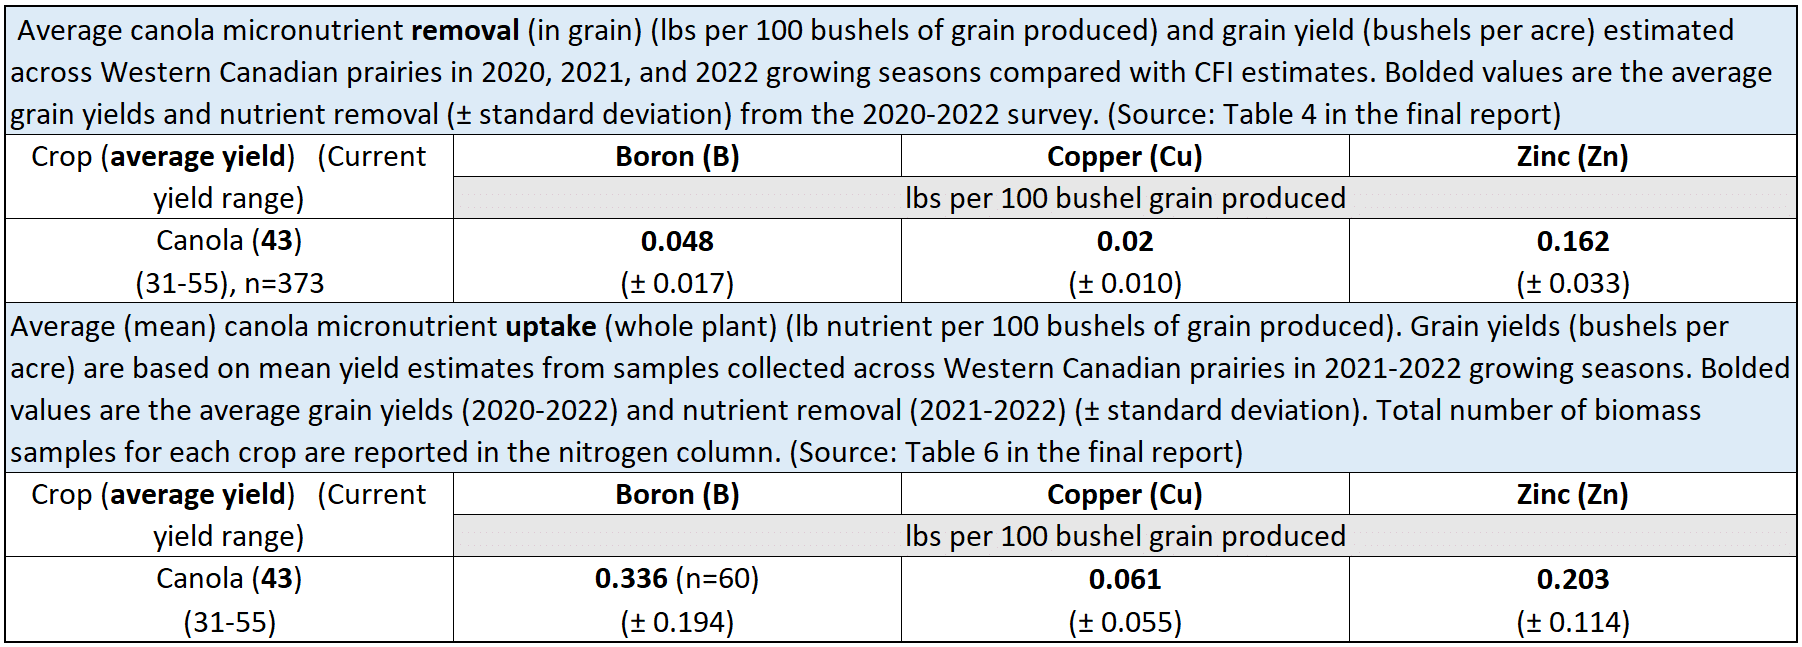
The new guidelines include removal and uptake estimates for macronutrients (N, P2O5, K2O, S) and micronutrients (Cu, Zn, B). The purpose of these estimates is not to replace soil testing, but to assist in developing fertilizer management plans, or to help interpret soil test reports. These estimates should always be used in conjunction with soil testing.
New resource developed
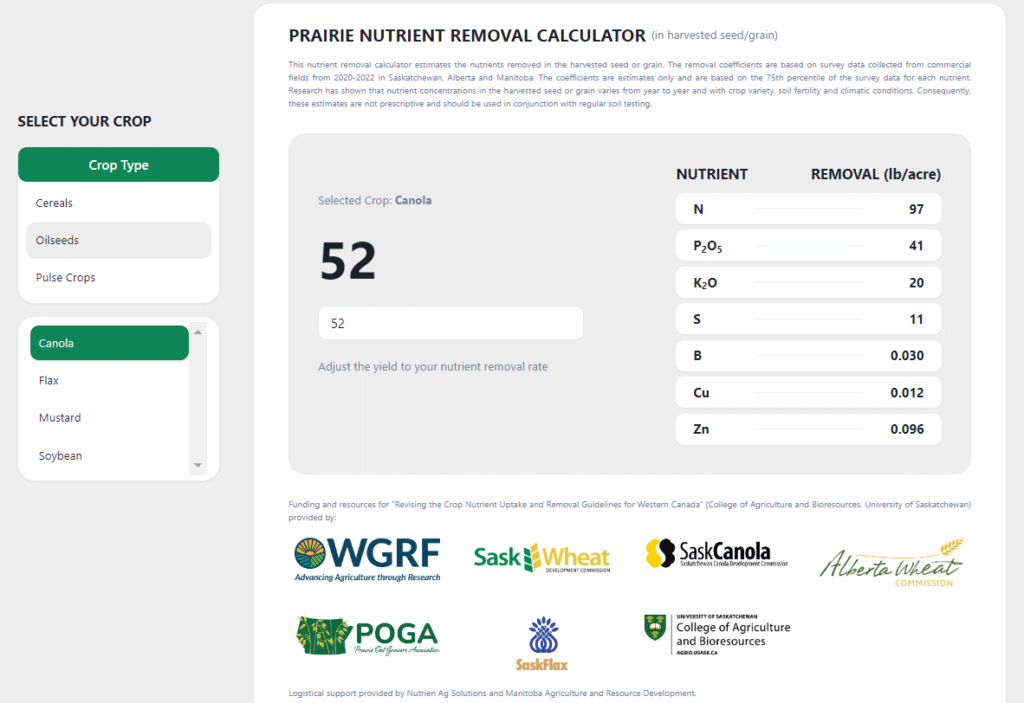
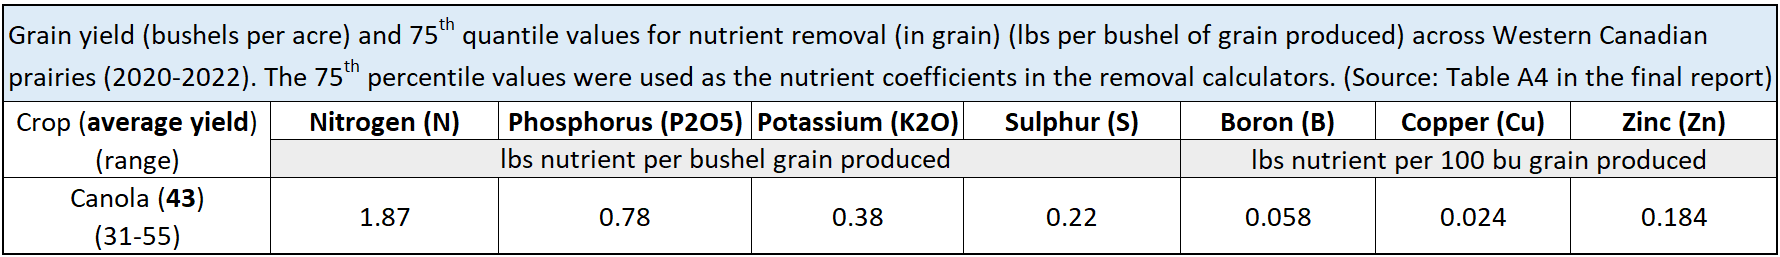
The online Prairie Nutrient Removal Calculator estimates nutrient uptake and removal based on results from this latest study. The calculator uses the 75th percentile of the survey data as the nutrient coefficient, with the goal of limiting the risk of underestimating nutrient removal. The 75th percentile represents that point at which 75 per cent of the survey values were below the coefficient value and 25 per cent of the values were above the coefficient value.
Related references
This project was referenced in the following presentation and Canola Watch podcast.