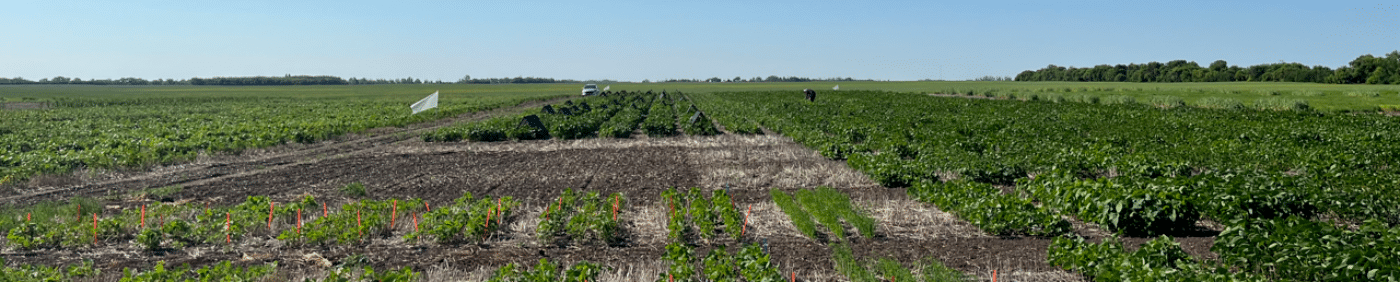
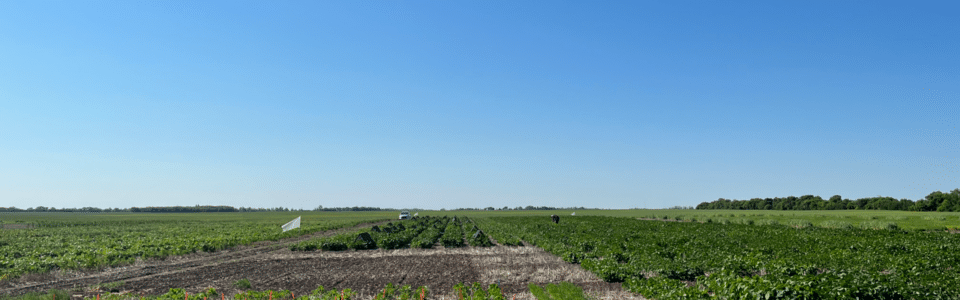
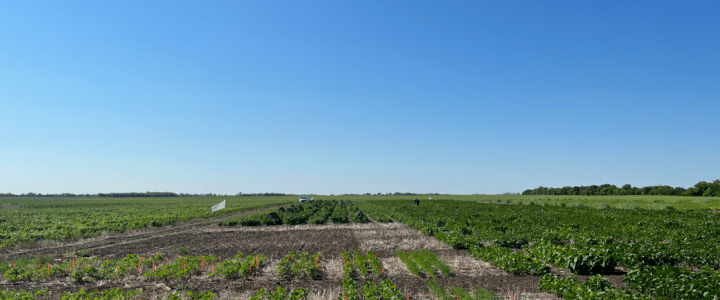
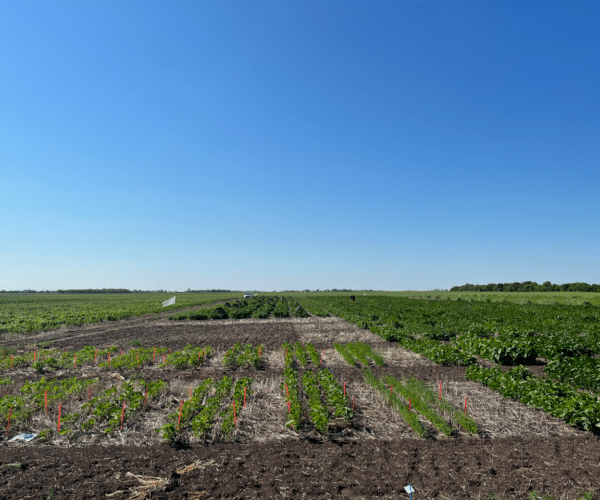
Photo credit: Nate Ort
The results of the Integrated Crop Agronomy Cluster (ICAC) was recently released by the Western Grains Research Foundation (WGRF), which funds the program along with Agriculture and Agri-Food Canada under the Canadian Agricultural Partnership, and many industry partners.
The seven research activities outlined in the summary report range from soil health to herbicide resistance and climate change adaptation and are aimed at providing farmers with valuable insight as they tackle widespread agronomic challenges.
The canola-focused research activities that are also featured on the Canola Research Hub include:
- Coordinated monitoring of field crop insect pests in the Prairie Ecosystem
- Coordination of a crop disease monitoring network for Western Canada
- Optimizing systems productivity, resilience and sustainability in the major Canadian ecozones
The other research activities which are featured in the 2018-2023 summary report are:
- ‘Selecting crop sequences and developing a risk model to mitigate FHB in western Canadian cereal production’ led by Randy Kutcher and Paul Bullock
- ‘Management of glyphosate-resistant kochia in western Canadian cropping systems’ led by Charles Geddes
- ‘Spray Drift Management Under Changing Operational Requirements’ led by Ian Paulson (PAMI)
- ‘Economic and Agronomic Performance of Emerging Cropping Systems for Western Canada’ led by Ramona Mohr
Learn more about the researchers behind these projects in the ICAC 2018-2023 summary report.
Apply this on your farm
- See which rotation had the best yield stability, net revenue, precipitation use efficiency and nitrogen use efficiency in your region.
- Research reported choosing a rotation with >2 crop species that includes pulses, can optimize yield and yield stability in SK & AB.
- Attend one or more summer events.
- Sign up to the Prairie Pest Monitoring Network.
- Check out Prairie Crop Disease Monitoring Network blog posts.
- Use this research to better manage kochia.
Optimizing system productivity
In the ‘Optimizing systems productivity, resilience and sustainability in the major Canadian ecozones‘ project, six carefully designed cropping systems were evaluated at seven major Canadian Prairie ecosites.
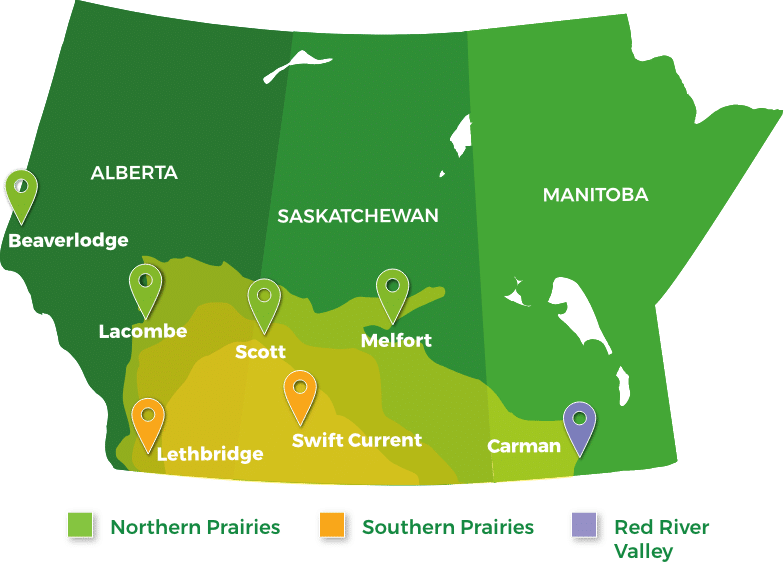
The six crop rotations vary from site to site to reflect the site-specific conditions and were referred to under the following categories:
- Control: historically recommended, four-year crop rotation.
- Intensified: oilseed intensified in the northern Prairies or pulse crop intensified in the southern Prairies
- Diversified: multiple crop types, diversified rotations
- Market driven: crop types selected based on annual commodity prices
- High risk: introduce new crop types that may not be adapted for the geographic region
- Soil health: include green manures and intercrops to improve soil health
The systems were evaluated for yield and yield stability, precipitation use efficiency, net revenue, nitrogen use efficiency by a multidisciplinary team of researchers from federal/provincial governments and universities.
- Precipitation use efficiency is the total grain yield produced (expressed as canola equivalent yield) divided by the growing season rainfall (between May 1- August 31).
- Canola equivalent yield allowed for yield comparisons between different crop rotations by standardizing the crop rotation’s yield based on the price ratio of different crop types relative to canola.
- Net revenue is the total yield value (based on average crop prices from 2012-2021) from each crop and subtracting total costs (which include seed cost, fertilizer costs, pesticide costs, other variable costs, and fixed costs).
- Nitrogen use efficiency is the ratio of grain yield (expressed as canola equivalent yield) to available nitrogen (soil mineral nitrogen + applied nitrogen fertilizer).
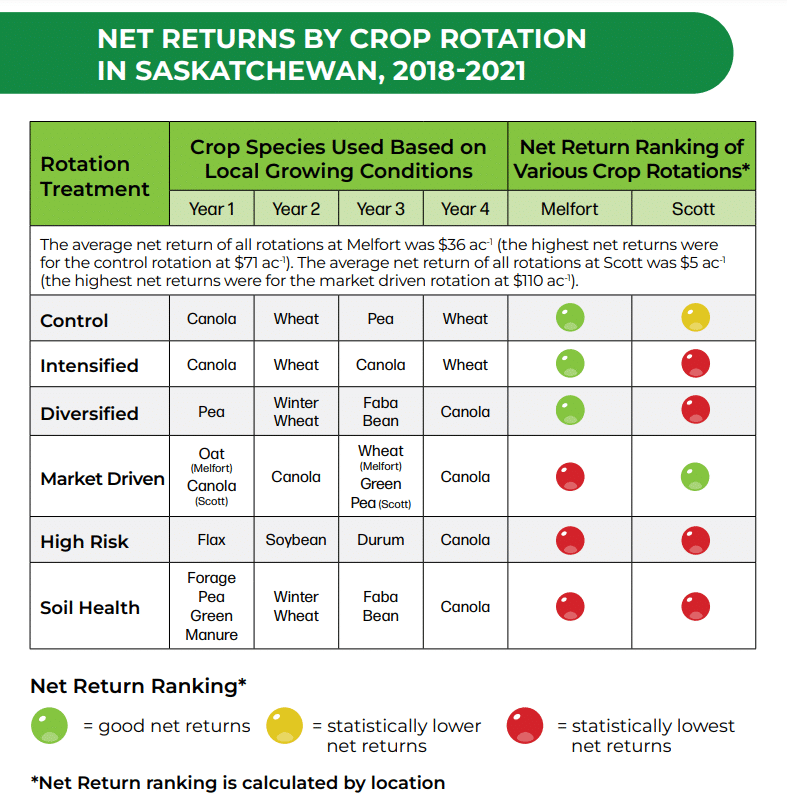
Key findings for the Northern Prairies (Beaverlodge and Lacombe, AB and Scott and Melfort, SK sites)
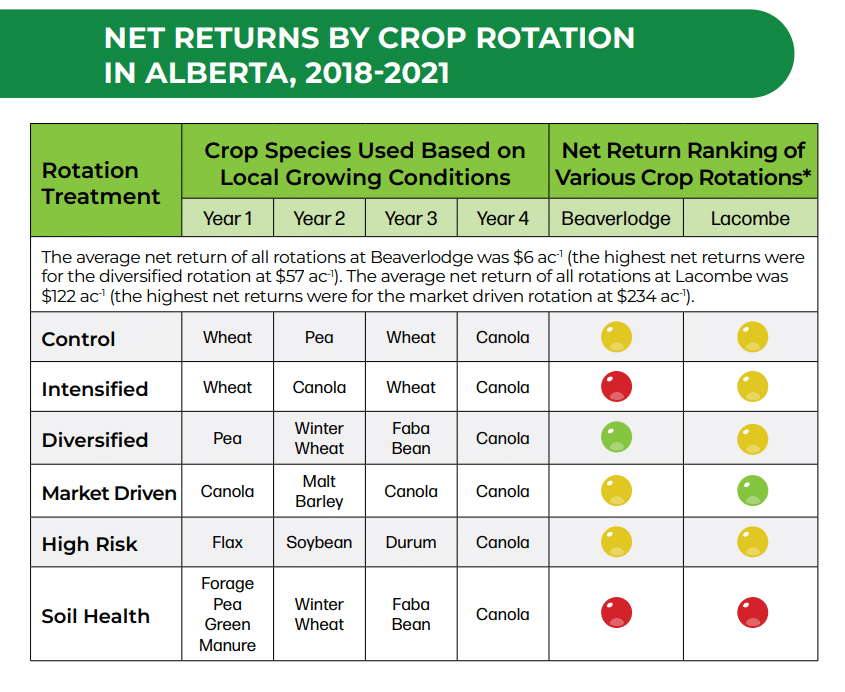
The net returns from the two Northern Prairie sites in Alberta, 2018-2021 (from the Net Revenues Northern Prairies factsheet).
See more at the Resilient rotations factsheets.
See more at the Resilient rotations factsheets.
- None of the six region-specific crop rotations had a consistently greater precipitation use efficiency. Due to the lack of grain production in the green-manure phase of the rotation, the ‘soil health rotation’ had lower precipitation use efficiency. Learn more in this factsheet.
- When averaged across all six rotations, the ‘intensified rotation’ (canola-wheat-canola-wheat) was the most stable crop rotation (for yields), while the ‘market driven rotation’ (which varied by province) and the ‘high risk rotations’ (flax-soybean-durum-canola) were the least stable (for yields). Learn more in this factsheet.
- The ‘market driven rotation’ and the ‘diversified rotation’ can have higher net returns because of the high frequency of canola in the rotation and the high canola crop prices and because of the high crop yields, respectively. Learn more in this factsheet.
- However, the ‘market driven rotation’ also has the highest input costs and is an agronomically risky practice due to elevated disease pressure concerns.
- The ‘diversified rotation’ consistently had some of the highest nitrogen use efficiencies, which is likely from having pulse crops in the rotation for two of four years and winter wheat which is able to make use of available nitrogen late in the fall and early in the spring. Learn more in this factsheet.
Key findings for the Southern Prairies (Lethbridge, AB and Swift Current, SK sites)
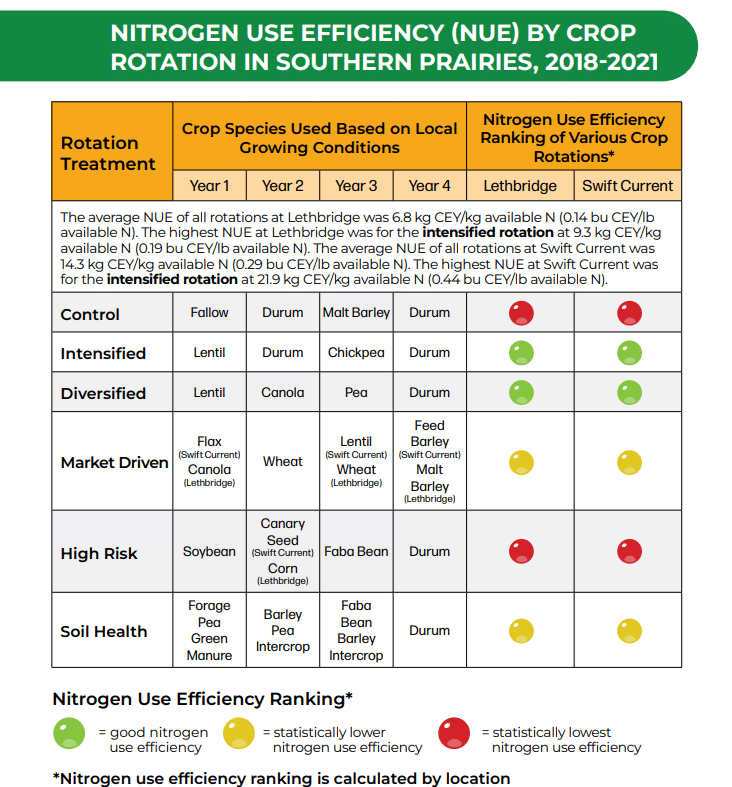
On average, the 2018-2021 growing seasons in the southern Prairies were drier than normal and growth was unusually poor.
- The ‘intensified rotation’ (lentil- durum-chickpea-durum) and the ‘market-driven rotation’ (varied by location) had the best precipitation use efficiency and the ‘high-risk rotation’ consistently had the poorest precipitation use efficiency rotation in this region, when almost all site years were drier than average. Read more in this factsheet.
- There was rarely one rotation that was consistently the highest yielding, so it is recommended to select a rotation with more than two crop species, and select for more pulse crops in rotations. For example, the ‘intensified rotation’ (lentil- durum-chickpea-durum) was well suited for yield and managing yield risks. Read more in this factsheet.
- The ‘high risk rotation’ (soybean-canary seed/corn-faba bean-durum) had lower yields partly because the crops were not well suited to the environment where they were planted.
- All rotations at Lethbridge had negative net returns and the soil health, control and high risk rotations at Swift Current all had negative net returns, which suggests that producers should focus on minimizing risk by selecting rotations with lower total costs.
- The ‘intensified rotation’, which reflected common crop types grown in these areas, performed better than other rotations. Read more in this factsheet.
- The ‘intensified rotation’ and ‘diversified rotation’ consistently had the highest nitrogen use efficiency in this region, which is likely attributed to the pulse crops in two of four years in the rotation. Read more in this factsheet.
- The soil health rotation did not have a high nitrogen use efficiency because of its low yield, despite having almost half of the applied nitrogen fertilizer compared to other rotations.
Key findings for the Red River Valley (Carman, MB site)
The study was conducted under hotter and drier than average conditions, which favored corn. In growing seasons with more precipitation, the other crop species may have better performance.
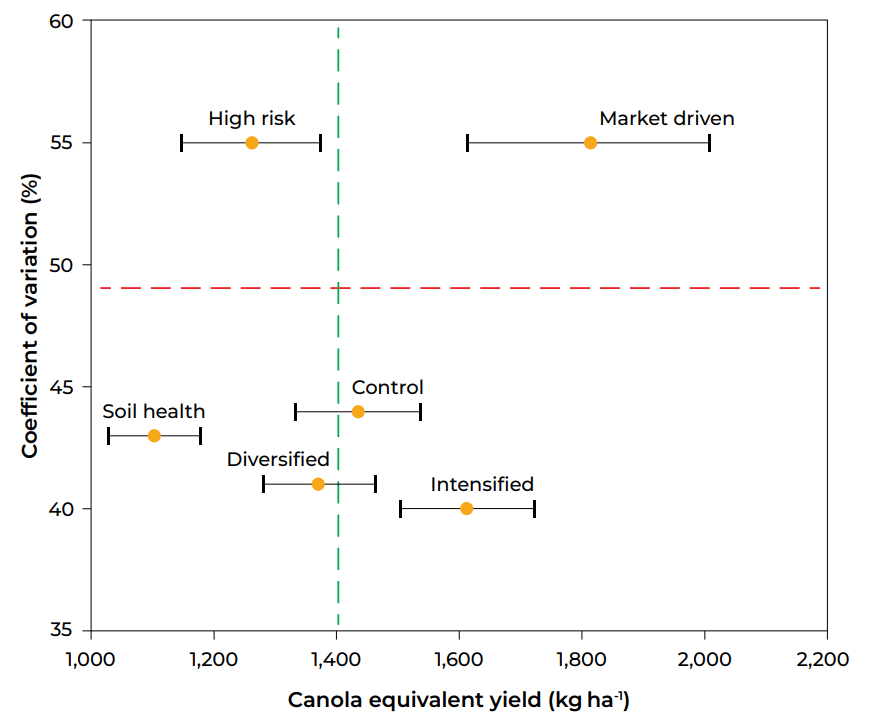
Note – The horizontal black bars represent standard error of the mean. The vertical green line indicates canola yield equivalent across all six crop rotations. The horizontal red line is the average coefficient of variation across all six crop rotations.
- The ‘high risk rotation’ (corn-dry bean- canola-sunflower) followed by the ‘market driven rotation’ (corn-corn-oat-canola) had better precipitation use efficiency, due to the high corn yields in these rotations. Read more in this factsheet.
- The ‘high risk rotation’ had the highest yields (22-57% greater than other rotations). This and the ‘market driven rotation’ were mainly successful because they included corn in the rotations. Yields from the other three rotations were statistically similar. Read more in this factsheet.
- The ‘market driven rotation’ and ‘high risk rotation’ had the most profitable net returns, likely because of high corn yields in these rotations. However, the market driven rotation also has the highest input costs. Read more in this factsheet.
- The ‘high risk rotation’ had the highest nitrogen use efficiency, likely because of the high corn and sunflower yields in the rotation for two of four years. Read more in this factsheet.
- Again, the soil health rotation did not have a high nitrogen use efficiency because of its low yield, despite having almost half of the applied nitrogen fertilizer compared to other rotations.
Conclusions and future work
The researchers concluded that no single cropping system that is suitable for all of Western Canada. Site specific cropping systems need to be based on local conditions. Where possible (based on growing conditions in the region) is also recommended to select a rotation with more than two crop species, and select for more pulse crops in rotations.
In the future, the research team expects to provide a road map or decision tree of information for producers to consider for future crop rotation decisions. For example, producers could first identify their top concern – nutrient use efficiency, weed control, economics, etc. – in their region and then look to options within that branch for recommendations for their farm.
Related resources
To support your record-keeping and financial tracking efforts, check out the provincial cost of production guides:

Summer events to attend
- July 5-6 & 12-23, 2023: Manitoba Crop Diagnostic School – Carman, MB
- July 11, 2023: Lethbridge College Research Farm Field Day – Lethbridge, AB
- July 11, 2023: Sask Crops Field Tour – Plenty, SK
- July 11-12, 2023: Grain Dryer Setup College – July 11 in Carroll & July 12 in Morris, MB
- July 12, 2023: Western Applied Research Corporation Field Day – Scott, SK
- July 13, 2023: Farming Smarter 2023 Plot Hop – Lethbridge, AB
- July 18, 2023: Chinook Applied Research Association 2023 Crop Tour Day – Oyen, AB
- July 18, 2023: Indian Head Agricultural Research Foundation Field Day – Indian Head, SK
- July 18-20, 2023: Ag in Motion – Langham, SK
- July 20, 2023: East Central Research Foundation Field Day – Yorkton, SK
- July 20, 2023: Wheatland Conversation Area Tour – Swift Current, SK
- July 25, 2023: Wheatstalk 2023 – Vermillion, AB
- July 25-26, 2023: Saskatchewan Crop Diagnostic School – Indian Head, SK
- July 27, 2023: North Peace Applied Research Farm July Tour – North Star, AB
- July 27, 2023: Conservation Learning Center Annual Field Day – 18km south of Prince Albert on Hwy 2
- August 3, 2023: Combine Clinic for Agronomists – Langham, SK
- August 9, 2023: Manitoba 4R Day – Grosse Isle, MB
Published June 21, 2023