Key Result
No major differences were noticed between the seeding systems. Soil aggregation, water use, and root growth improved with the use of fertilizer. Soil test measurements guided the fertilizer recommendations and proved to be effective. If residual soil nutrients measured high, low rates were applied to encourage plant use of residual nutrients for a competitive yield, which was achieved.
Project Summary
The objectives were to assess the effects of different soil test based fertilizer rates and seeding systems on canola and cereals (wheat / barley) growth, production and soil properties; and communicate the information to the producers and others. Field trials were near Donnelly (NW7-77-20W5; GPS: 55o 39’38.43”N, 117o 6’10.64”W), southeast Peace Region, Alberta. From 2010 to 2015 (6 yrs), combinations of two seeding systems (DS – direct seeding and CT – conventional tillage) and four fertilizer rates (0, 60, 100 and 140% of the soil tests based recommendation) were repeated on the same plots using a canola – cereal (wheat in 2010 to 2012 and barley in 2013 and 2014) rotation. Each year, soil test results (0- 6 and 6-12 inch depths) were used to calculate the nutrient (N, P, K, and S) amounts to be applied for each treatment.
There were no clear trends for seeding system effects on the residual NO3-N, available P, extractable K, and sulphate S concentrations in the 0-6 inch soil. Increase in fertilizer rate increased (not always significant) the residual NO3-N, available P, and sulphate S concentrations, after the years with below normal rain and crop yield. There was not a systematic build up of residual nutrients level from higher fertilizer rates with passage of years. These results can help producers to save on fertilizers after a low crop yield year.
When there was higher residual NO3-N, available P and sulphate S levels after the crops at higher fertilizer rates, lower N, P and S fertilizer rates were recommended for some of those treatments. High yields in spite of lower fertilizer application in some of the higher fertilizer rate treatments indicated that the crops effectively used the residual nutrients.
The 2016 spring soil samples indicated increased stratification for some soil properties under with DS than CT at higher fertilizer rates. The OM, ENR and P concentrations showed a greater decline with increase in soil depth; whereas greater increase with soil depth was noticed for pH, Ca and Mg values. No change in stratification was noticed for the concentration of mobile nutrients like NO3 and S.
More vigorous crops with 100% fertilizer caused faster soil moisture depletion than 0%. The aggregate stability results showed positive effects of reduction in tillage intensity and increase in fertilizer. The effect was larger for the seeding system than fertilizer rate. The length, surface area, volume and number of tips for canola and barley roots were increased with fertilizer application and were greater DS than CT system. The length, surface area and volume of barley roots were greater than canola while the number of tips were in a similar range for both crops.
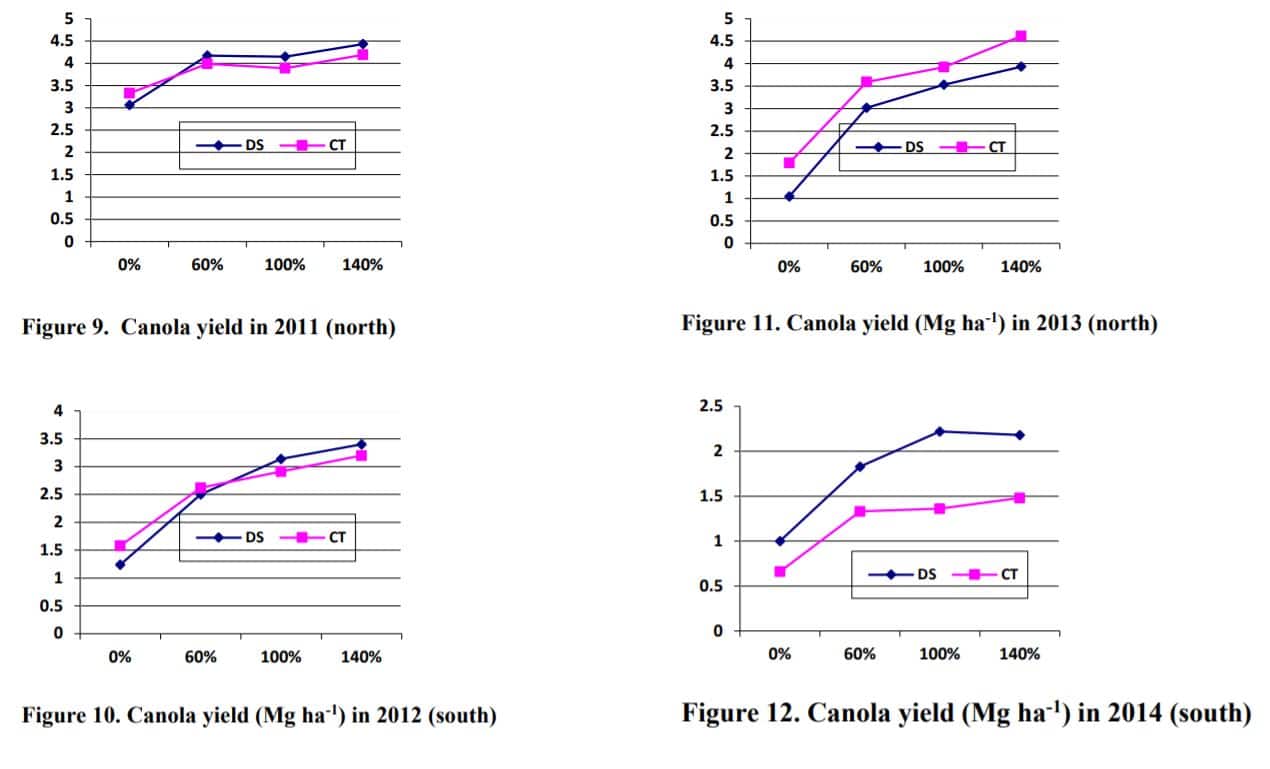
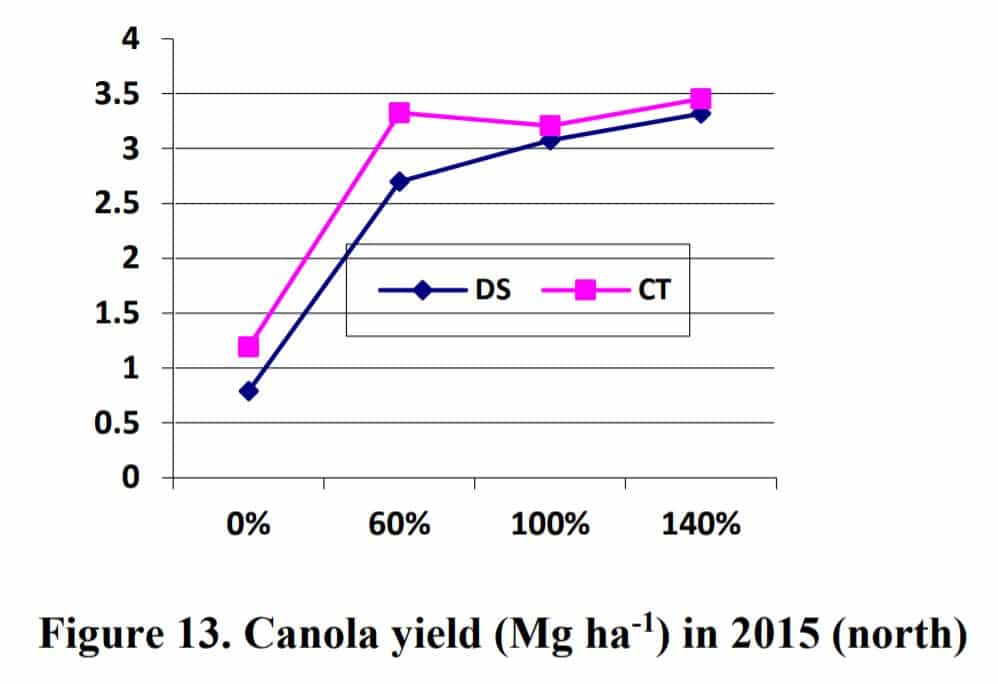
The response of canola and wheat seed yields to fertilizer rate increase was curvilinear and indicated diminishing response to fertilization at higher fertilizer rates. Overall, a fertilizer rate near 100% of recommendation was appropriate to achieve their optimum yields. Unlike canola and wheat, the nature of barley yield response to fertilizer rate change did not show a consistent linear or curvilinear response and data indicated 100% to 140% fertilizer rates to be appropriate for optimum barley yield. Averaged across years, the seed yield was very slightly greater under DS than CT system (23 to 67 kg ha-1 yr-1).
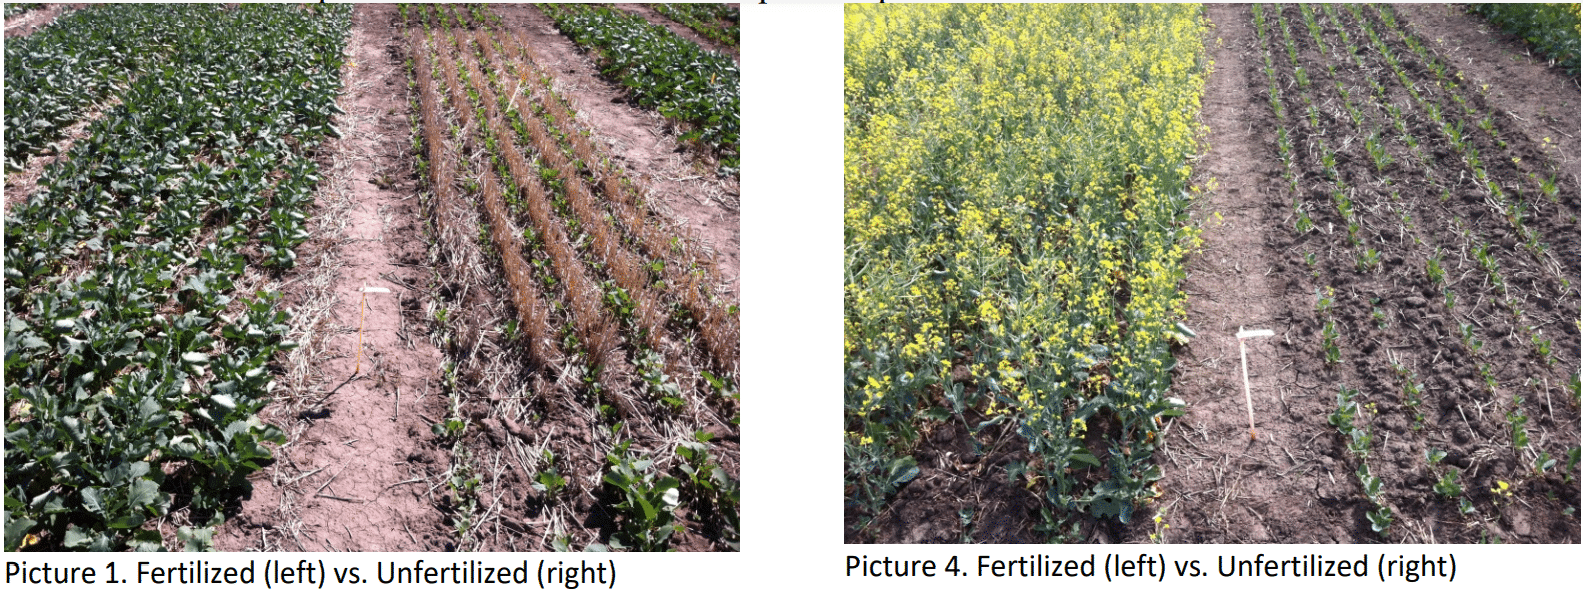
Compared to 0% fertilizer rate as reference (1), canola seed yield at 140% fertilizer rate was 1.35, 2.34, 3.00, 2.20 and 3.25 times in 2011, 2012, 2013, 2014 and 2015, respectively. Similarly, cereals seed yield at 140% was 1.05, 1.30, 1.26, 1.31, 1.18, and 1.43 times in 2010, 2011, 2012, 2013, 2014 and 2015, respectively. These relative yields showed that the percent seed yield response to fertilizer became larger with passage of years, indicating that repeated use of fertilizer on the same area widened the gap in productivity of fertilized and unfertilized plots. Apparently, some of the added fertilizers were being recycled in the soil for subsequent crops. This also suggests that fertilizer use efficiency based on application year data only is underestimated. Long term nutrient use efficiency can provide a better estimation.
Overall, residual nutrients measured by soil tests can assist producers to optimize fertilizer rates and save costs. Fertilizer additions improved soil water use, soil aggregation and root growth. Fertilizer effect on crop yield was enhanced with years of repeated use and some nutrients were recycled for subsequent crop via soil. No major differences were noticed between the seeding systems. Stratification of some soil properties needs more study.